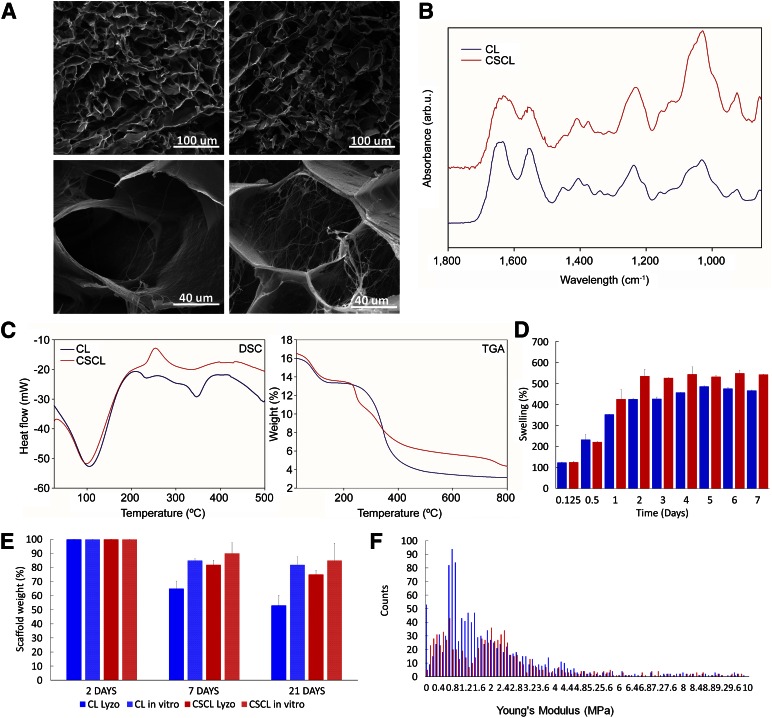
Figure 1.
Structural and chemical characterization of the scaffolds. (A): Scanning electron microscopic images of CL and CSCL at different magnification. Scale bars are included in the figure. (B): Attenuated total reflection/Fourier transform infrared spectroscopy spectra of CL and CSCL. The spectra highlighted the presence of CS inside the collagen scaffold represented mainly on the sugar peaks that arise around 1,000 cm−1. (C): Differential scanning calorimetry elucidated the thermal transitions of the CSCL respect to CL while thermal gravimetric analysis quantified the weight percentage of chondroitin sulfate in the scaffold. (D): The degradation percentage of CL (blue) and CSCL (red) scaffolds by lysozyme in phosphate-buffered saline solution. (E): Swelling characteristics in CL and CSCL over time. (F): Distribution of Young’s modulus values for CL (blue) and CSCL (red). Abbreviation: CL, collagen scaffold; CSCL, chondroitin sulfate crosslinked onto a collagen-based scaffold.

