Figure 2.
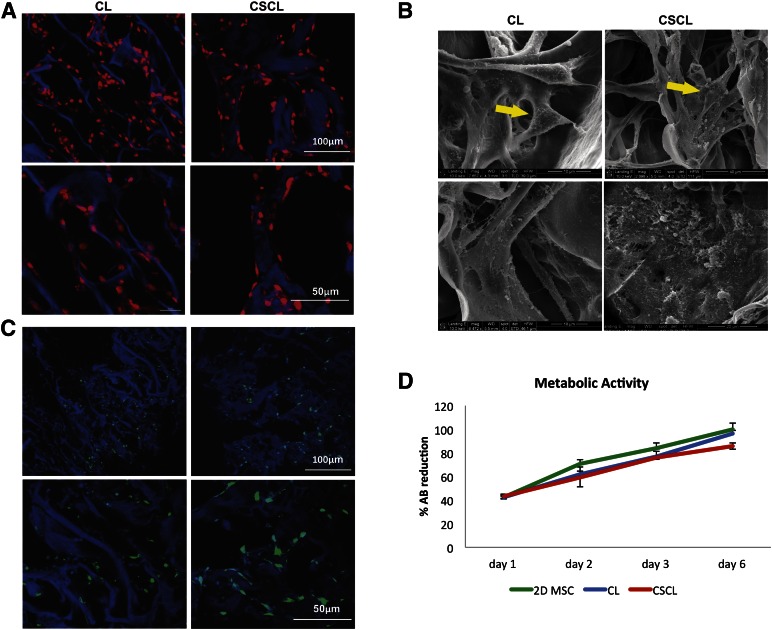
MSC spreading, viability, and proliferation. Confocal (A) and scanning electron microscopic (SEM) (B) images showing MSC spread onto CL and CSCL scaffolds at different magnifications. MSCs align along the walls of the scaffolds in the presence of chondroitin sulfate and organize in three-dimensional structures when grown onto CL (A, B). SEM images reveal a greater production of microvesicles when MSCs are exposed to CSCL (arrows). Scale bars are included in the figure. CSCL and CL scaffolds support MSC viability (C) (Live/Dead assay) and proliferation (D) (Alamar blue assay). Temporal changes in the %AB are shown as representative of the presence of metabolically active cells over time. A cumulative increase in %AB reduction was found, reflecting ongoing cell proliferation. MSCs grown in two-dimensional conditions are also reported for comparison. Data are shown as mean of three independent biological replicates ± SD. Abbreviations: %AB, percentage of Alamar blue reduction; CL, collagen scaffold; CSCL, chondroitin sulfate crosslinked onto a collagen-based scaffold; MSC, mesenchymal stem cell.

