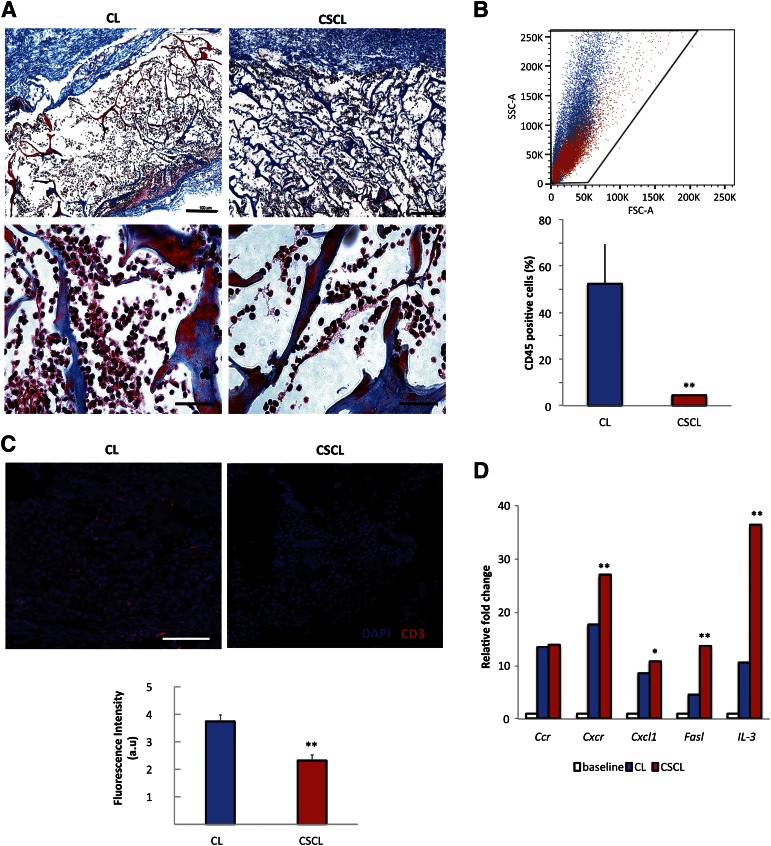
Figure 4.
CSCL immunosuppressive potential when subcutaneously implanted in rats in vivo for 24 hours. (A): Masson’s trichrome-stained sections of CL and CSCL ex vivo (original magnification, ×4 and ×40). Scale bars = 100 μm for ×4 magnification and 10 μm for ×40 magnification. (B): Representative morphological plots showing cells harvested from CL (blue) and CSCL (red) scaffolds. Histograms represent the percentage of CD45-positive cells identified at 24 hours. Asterisks depict highly significant (∗∗, p < .01) differences between CL and CSCL. (C): Immunofluorescence staining of CD3+ (red) infiltrate the scaffold in subcutaneous implant model. Scale bar = 50 μm. Data are quantified as mean fluorescence intensity with Nikon Element software. Asterisks depict significant (∗∗, p < .01) differences between CL and CSCL. (D): Quantitative polymerase chain reaction for the expression of genes involved in inflammatory cell apoptotic processes (Cxcr2, Cxcl12, Faslg, and IL-3). Data are represented as fold-change compared with the expression levels found in subcutaneous tissues with no inflammation (baseline) (n = 3; ∗∗, p < .01; ∗, p < .05). Abbreviations: au, arbitrary unit; CL, collagen scaffold; CSCL, chondroitin sulfate crosslinked onto a collagen-based scaffold; DAPI, 4′,6-diamidino-2-phenylindole; FSC-A, forward scatter pulse area; SSC-A, side scatter pulse area.

