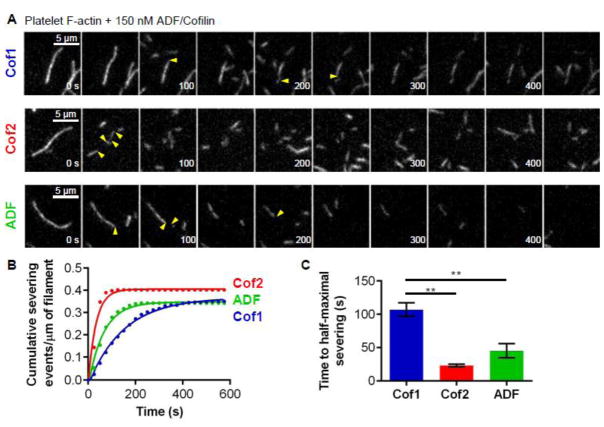
Figure 3. Rates of severing for 150 nM Cof1, Cof2, and ADF on filaments assembled from platelet actin.
(A) Representative time-lapse images from TIRF microscopy experiments where Oregon green-labeled actin filaments (platelet actin) were polymerized and tethered, and then 150 nM Cof1, Cof2, or ADF was flowed in. Severing events are indicated by yellow arrow heads. (B) Analysis of severing activities, in which each data point is the cumulative severing events per micron of filament at that time point, averaged from 3 independent experiments (20 filaments each). Data were fit to an exponential association curve. (C) Average time to half-maximal severing, calculated from exponential curve fits of data in (B). Error bars, SEM. Statistical significance was determined using a one-way ANOVA analysis and Bonferroni Multiple comparison test; ** indicates p < 0.05.

