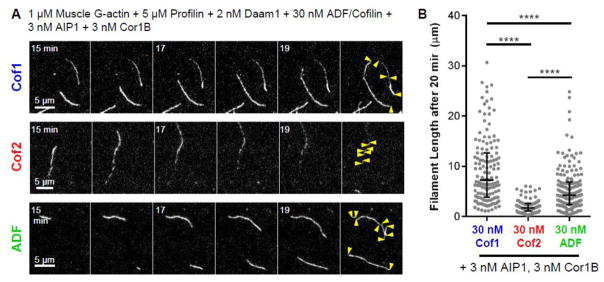
Figure 5. Effects of Cof1, Cof2, and ADF on actively growing actin filaments in the presence of co-factors Cor1B and AIP1.
(A) Representative time-lapse images from TIRF microscopy experiments using actively polymerizing labeled and tethered actin filaments. Reactions contain 1 μM G-actin (10% OG-labeled, 0.5% biotinylated), 2 nM Daam1 (FH1-FH2-C), 5 μM Profilin, 30 nM Cof1, Cof2, or ADF, 3 nM AIP1, and 3 nM Cor1B. Yellow arrows indicate filament ends 20 min after reaction initiation. (B) Distribution of filament lengths 20 min after reaction initiation. Median and interquartile range are shown. Statistical significance was determined using a Kruskal-Wallis and Dunn’s Multiple Comparison test. **** indicates p < 0.0001.

