Figure 2.
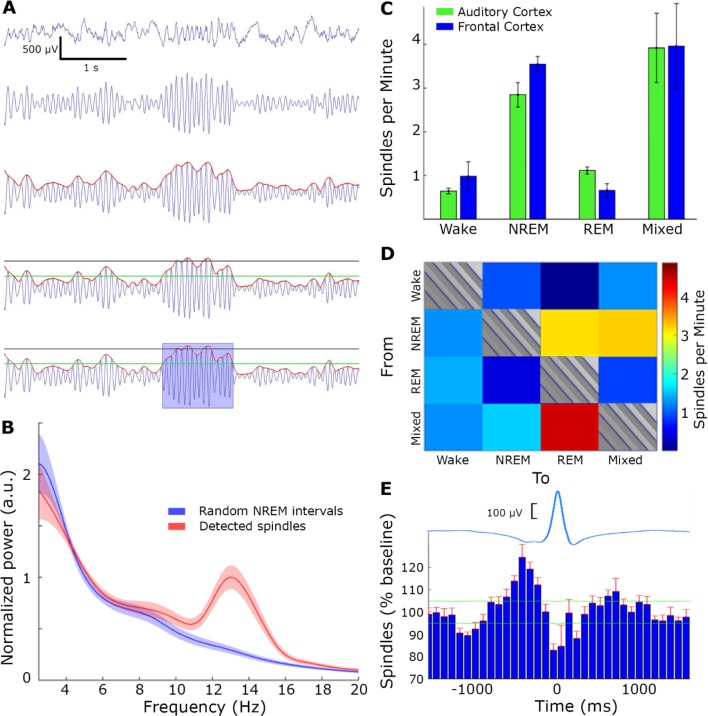
Spindle detection. (A) Spindle detection algorithm, from top to bottom: local field potential (LFP) raw data (first row) was band-passed to the sigma band (10–16 Hz, second row) and instantaneous amplitude (red line, third row) was extracted. Detection (black) and noise (green) thresholds were set (fourth row), and duration limits determined the detection of a spindle (blue rectangle, bottom row). (B) LFP power spectral density of detected spindle events (red) and random time intervals in non-rapid eye movement (NREM) sleep (blue). (C) Number of detected spindles per minute in each state, separately for A1 (green) and motor cortex (blue). Note the higher occurrence during NREM sleep and mixed states. (D) Number of detected spindles before state transitions (16 sec) reveal maximal occurrence around transitions between NREM to rapid eye movement (REM) sleep as well as transitions between NREM- > Mixed State- > REM. (E) Number of detected spindles around slow waves (time zero corresponds to OFF periods occurring along with LFP positive peak). Top, average LFP slow wave (blue); Bottom, histogram of spindle occurrence (percentage deviation from baseline; mean + standard error of the mean (SEM) across experiments in red). Horizontal green lines, confidence intervals (α = 0.001). Note higher spindle occurrence around up states.

