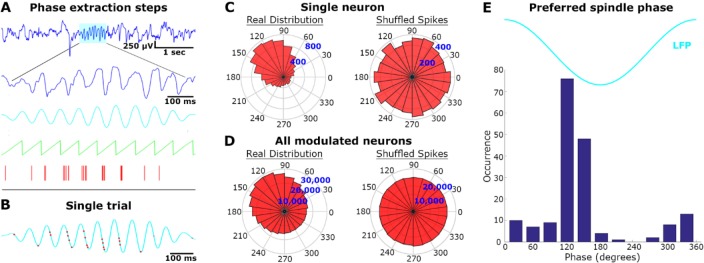
Figure 3.
Locking of unit discharges to sleep spindle phase. (A) Phase extraction steps: for each detected spindle (first row, cyan), the raw local field potential (LFP, second row) was band-pass filtered (third row, cyan) and the instantaneous phase (green) was compared to precise timing of neuronal action potentials (red bars). (B) Single trial example. The band-passed spindle from panel A is shown superimposed with its corresponding neuronal spikes (red dots). (C) Single neuron analysis across all spindles: spindle phase angular distribution of spikes from the same unit displayed in A (“real distribution”, left), and distribution of randomly shuffled spikes within each spindle (“shuffled spikes”, right). (D) Same as in C for all modulated neurons (n = 178/269, 66%). (E) Cumulative histogram of preferred spindle phase for all modulated neurons.

