Figure 7.
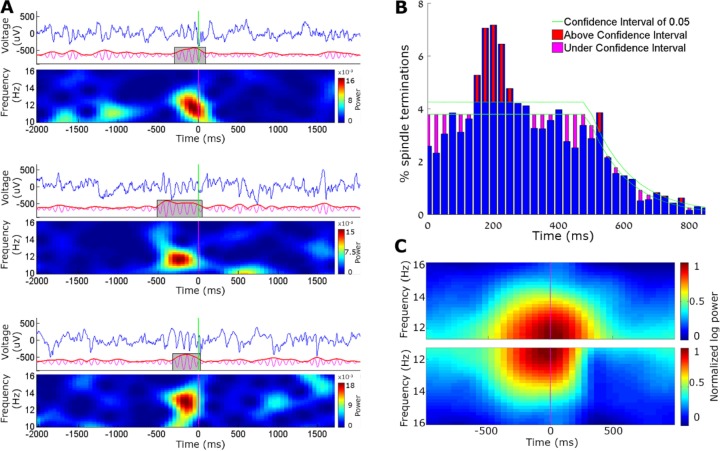
Auditory stimulation leads to early termination of sleep spindles in some trials. (A) Three representative example trials for the early termination of spindles upon auditory stimulation. In each example, top row shows the A1 local field potential (LFP, blue), middle row shows the detection procedure (10–16 Hz band-pass filtered signal in magenta, its envelope in red, and detected spindle in gray box), and the bottom depicting time-frequency dynamics (spectrogram). Vertical green line, sound onset. Note the abrupt termination of spindles upon auditory stimulation in all three instances. (B) Percentage of spindle terminations after loud tone stimuli. Blue bars show average number of spindle terminations in each time bin, and green lines depict the confidence interval (α = 0.05). Red and magenta bars show moments of statistically significant increases and decreases in spindle termination. (C) Mean time-frequency (spectrogram) representation of spindle events occurring along with loud tones, separately for (i) all trials (top, symmetric shape), and (ii) for “interrupted spindles” terminating between 150–250 ms after the sound (bottom, asymmetric shape, 30% of trials).

