
Figure 5.
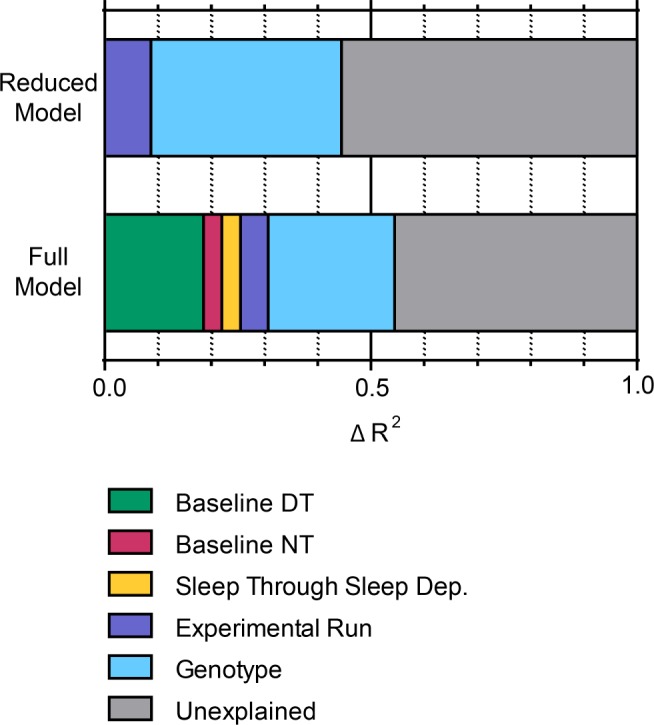
Δ R2 in hierarchical multiple linear regression models shows contribution of genotype cannot be explained by effect of genotype on baseline sleep. The Δ R2 is plotted for each variable from both the reduced model and the full model, described in Table 2. Variables were added hierarchically to the models in the order depicted (left to right). DT, daytime; NT, nighttime.