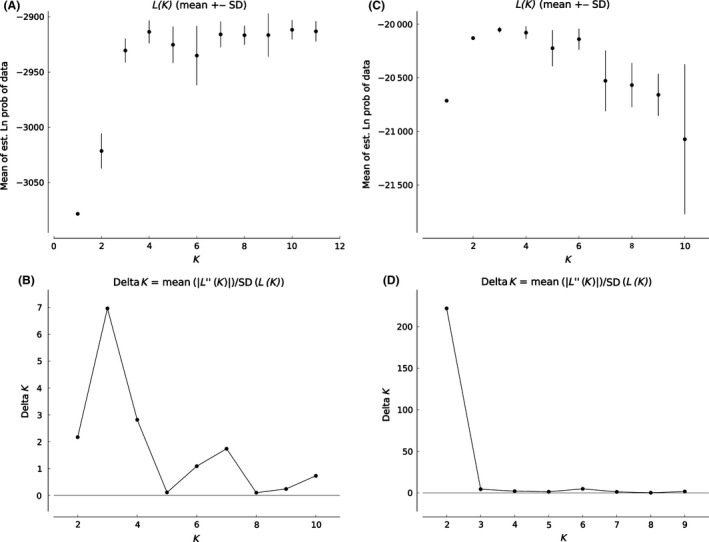
Figure 3.

Bayesian analysis of genetic structure from intronic (A and B) and microsatellite (C and D) data. (A and C) Distribution of the Estimated log Likelihood of K, L(K). (B and D) ΔK as a function of K. For L(K) each point corresponds to the mean L(K) ± SD across 20 independent runs.
