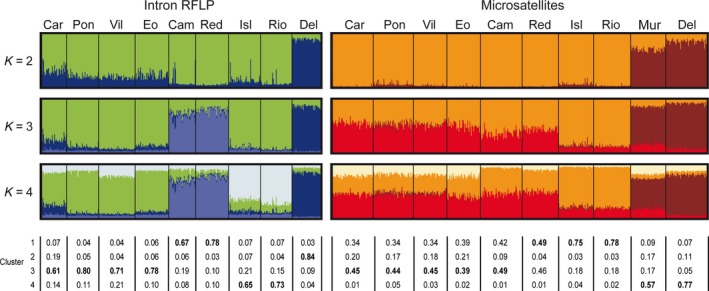
Figure 4.

Graphical representation of the estimated membership coefficients for each individual obtained from the Bayesian clustering analysis of genetic structure for K = 2–4 computed from introns and microsatellites. Each individual is represented by a bar broken into K colored segments. Percentages of membership of each cluster to each population for K = 4 are given below the chart, with the most common cluster in each population shown in bold.
