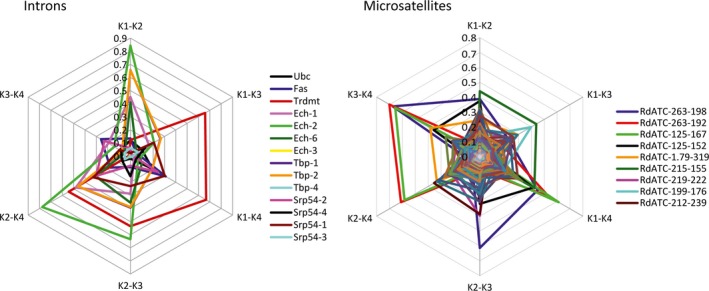
Figure 5.

Allelic contributions to the differentiation of the clusters inferred by the Bayesian clustering analysis for K = 4, for introns and microsatellites. Each allele is represented with a color line. Intersections with axes show the differences in allele frequencies between clusters for each cluster pair. Biallelic intron markers are named by its locus name as both alleles contribute the same to differentiation of clusters. Due to the intense allele pattern superposition, only the nine microsatellite alleles showing the most conspicuous patterns have been named in the legend.
