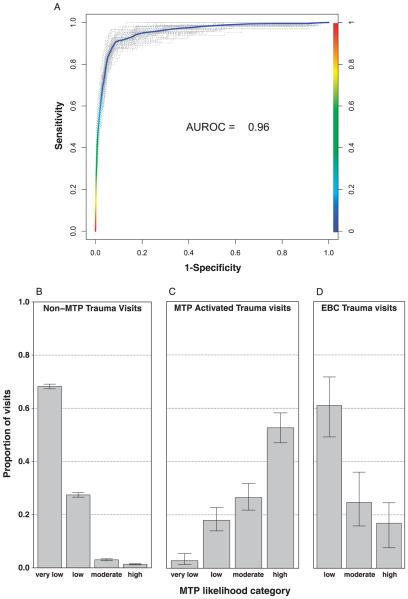
Figure 2.
Model validation and predictive performance. Model sensitivity and specificity (A) were measured for each of 500 development runs and mean area under the curve of the 500 runs was calculated. For each run, 20% of the data was randomly selected and withheld from model training. Model sensitivity and specificity were measured against this 20% for each run. For ease of visualization, 10% of the 500 runs were randomly chosen and plotted in A. Proportions of non-MTP trauma visits (B), MTP activated trauma visits (C), and EBCs (D) are plotted by their predicted MTP likelihood category. Error bars represent 95% confidence intervals using Wilson’s score method with continuity correction.

