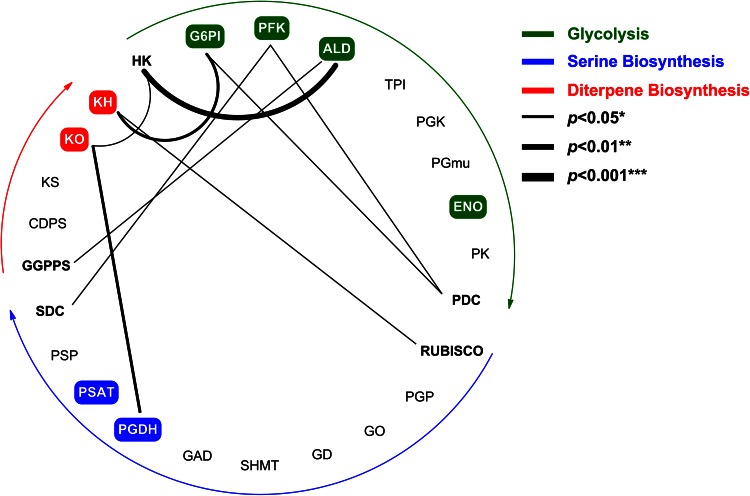
Fig. 5.
Positively co-expressed network of shortlisted genes during atisine biosynthesis in roots of A. heterophyllum. In each metabolic pathway, shortlisted genes are boxed with different color and significant positive correlations between the gene expression levels are shown by connected lines. Abbreviations are elaborated in supplementary Table 4

