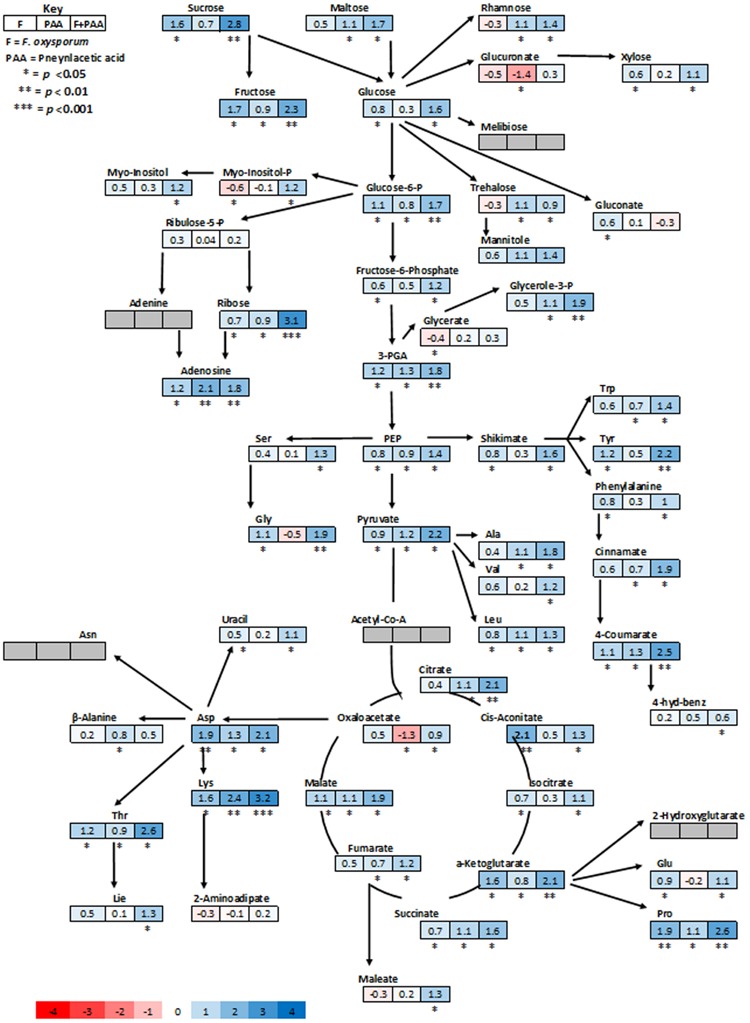
FIGURE 4.

Schematic representations of tomato metabolites in fold change as compared to untreated control plants. Different colors represent levels of metabolite fold change where blue is increasing and red is decreasing. Mean values of two independent experiments are presented here.
