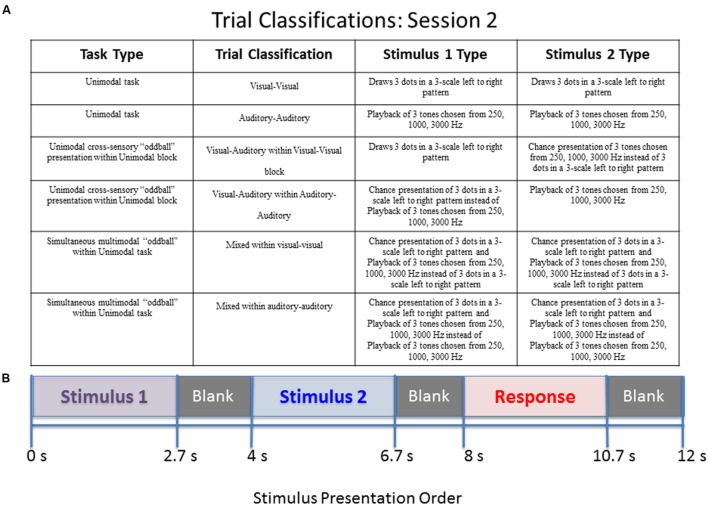
FIGURE 2.
Diagram of stimulus presentation design for session 2. (A) Description of the possible trial conditions presented in session 2. Mixed within auditory–auditory (oddball visual) – an auditory tone sequence followed by an auditory sequence 70% of the time, and a simultaneous audio–visual oddball 30% of the time. Mixed within visual–visual (oddball auditory) – a visual pattern followed by a visual sequence 70% of the time, and a simultaneous audio–visual oddball 30% of the time. (B) Schematic of study design. During the “response” segment the participant pressed a button to indicate whether the tones or dots in pattern 1 were the same as those in pattern 2.

