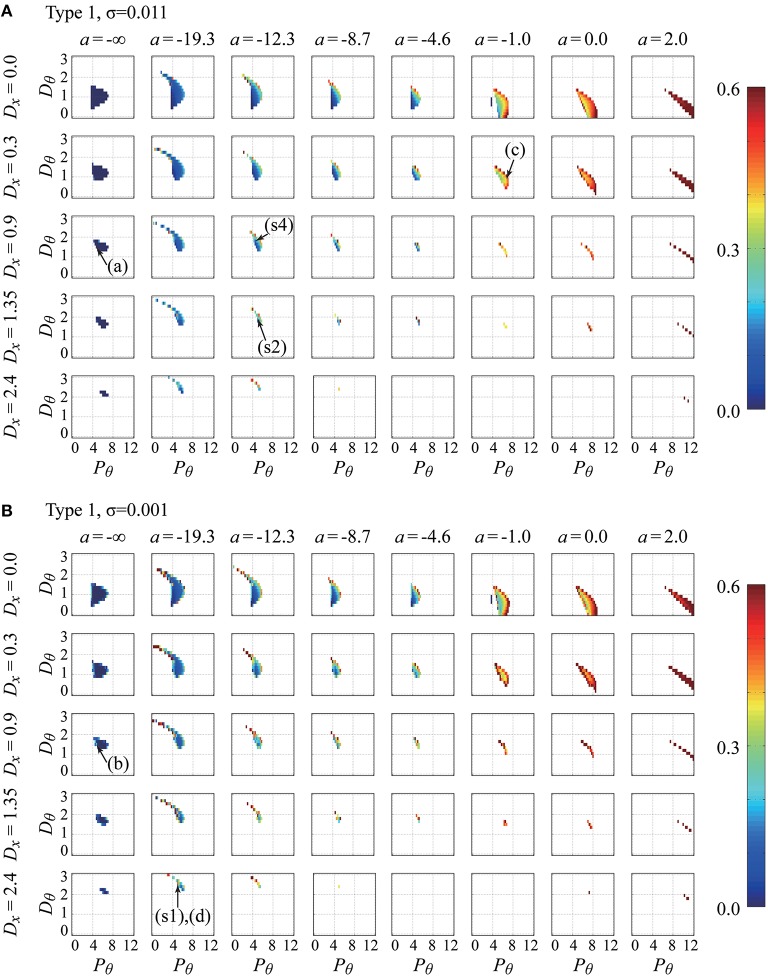
Figure 4.
Parameter dependency of stability and the non-Gaussianity index for the movement variability of the pendulum in the type-1 intermittent feedback control models with two typical noise intensities (delay-time Δ = 0.1s). Values of the index were calculated for the model with various parameter vectors = (a, Pθ, Dθ, Dx, σ, type = 1), which are plotted by color-code in the Pθ-Dθ planes for a set of combinations of the values of a (columns) and Dx (rows). The noise intensity is σ = 0.011 for the upper sets (A) of the Pθ-Dθ planes and σ = 0.001 for the lower sets (B) of the Pθ-Dθ planes. Because the index values can be calculated only when the models exhibit stable dynamics, the colored regions also represent the stability regions of the model. The parameter points indicated by the arrows with (A–D) are used for generating the time-series shown in Figures 5A–D, respectively. Those with (s1), (s2), and (s4) are the parameter points that best fit the experimental behaviors for Subjects 1, 2, and 4, respectively. Note that the best-fit noise intensities for (s1), (s2), and (s4) are not the values used for these panels (see Table 3 for the exact values). See the text for details.

