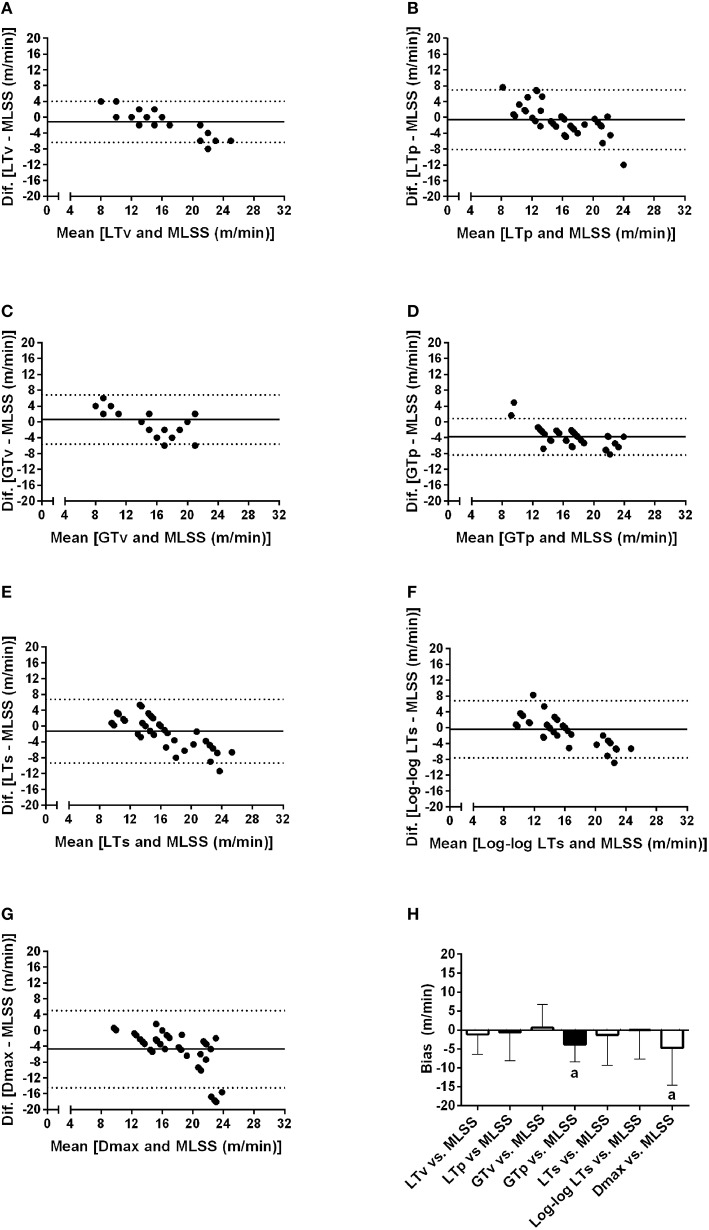
Figure 4.
Bland-Altman plots of the lactate threshold (LT) and glycemic threshold (GT) velocities vs. the maximal lactate steady state (MLSS) velocity. (A–G) Individual analysis of the concordance between each method and maximal lactate steady state velocity through the Bland and Altman plots. (H) shows the average and standard deviation of the bias for each method. aP < 0.05 vs. zero.

