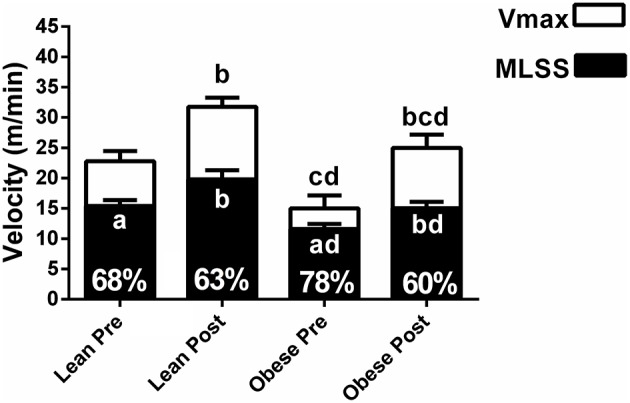
Figure 6.

Maximal velocity (Vmax) and velocity of the maximal lactate steady state (MLSS) for lean and obese rats at pre- and post-training. The numbers inside the bars show the percentage that the MLSS velocity occurred in comparison with the Vmax. Letters inside the bars indicate P values for the MLSS. Letters above the bars indicate P values for the Vmax. aP < 0.05 MLSS (%) vs. 60% within each group; bP < 0.05 vs. pre within group; cP < 0.05 vs. pre between groups; dP < 0.05 vs. post between groups. ANOVA main effects: Vmax - group P < 0.0001, time P < 0.0001, interaction P = 0.03; MLSS - group P < 0.0001, time P < 0.0001, interaction P = 0.14).
