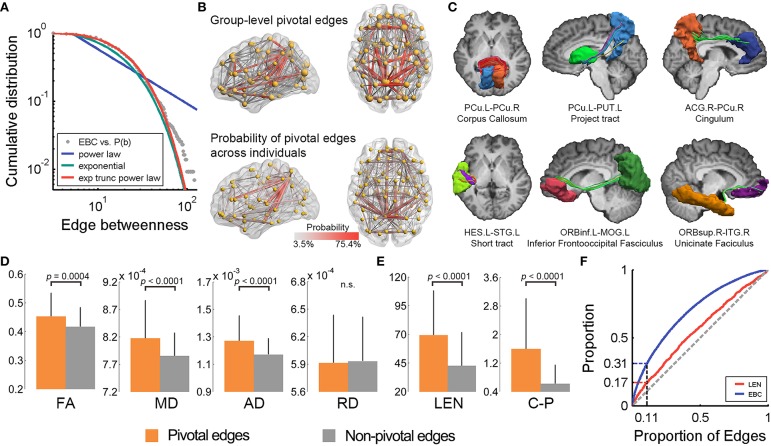
Figure 2.
The pivotal edges and their wiring substrates in the human WM network. (A) The EBC distribution of the WM network was best fitted by an exponentially truncated power-law form. (B) The spatial pattern of the pivotal edges (red) of the group-level WM network (upper) is quite similar to the probability map of the pivotal edges across individuals. (C) Several pivotal WM edges were manifest in one representative subject. (D) The pivotal edges showed significantly higher levels of WM microstructural organization, as indicated by FA, MD, and AD, but not RD, than the non-pivotal ones. The error bars represent the standard deviation. (E) The pivotal edges also had greater streamline length and better cost-performance than the non-pivotal ones. (F) The curves for the proportion of edges vs. proportions of EBC and streamline length. EBC, edge betweenness centrality; exp, exponential; trunc, truncated; PCu, precuneus; PUT, putamen; ACG, anterior cingulate and paracingulate gyri; HES, Heschl's gyrus; STG, superior temporal gyrus; ORBinf, inferior frontal gyrus, orbital part; MOG, middle occipital gyrus; ORBsup, superior frontal gyrus, orbital part; ITG, inferior temporal gyrus; FA, fractional anisotropy; MD, mean diffusivity; AD, axial diffusivity; RD, radial diffusivity; LEN, streamline length; C-P, cost-performance; n.s., not significant; L, left; R, right.

