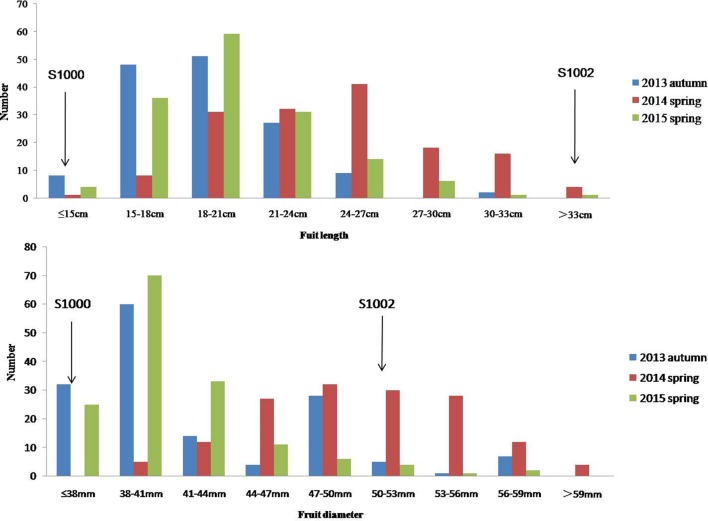
FIGURE 3.
Phenotypic evaluation of fruit length and fruit diameter for S1000, S1002, and F3. The Y axis is the number of plant individuals. The X axis is continuous, for the figure fruit length, it means the fruit length (fl) ≤ 15 cm, 15 cm < fl ≤ 18 cm, 18 cm < fl ≤ 21 cm, 21 cm < fl ≤ 24 cm, 24 cm < fl ≤ 27 cm, 27 cm < fl ≤ 30 cm, 30 cm < fl ≤ 33 cm, fl > 33 cm; for the fruit diameter, it means the fruit diameter (fd) ≤ 38 mm, 38 mm < fd ≤ 41 mm, 41 mm < fd ≤ 44 mm, 44 mm < fd ≤ 47 mm, 47 mm < fd ≤ 50 mm, 50 mm < fd ≤ 53 mm, 53 mm < fd ≤ 56 mm, 56 mm < fd ≤ 59 mm, fd > 59.

