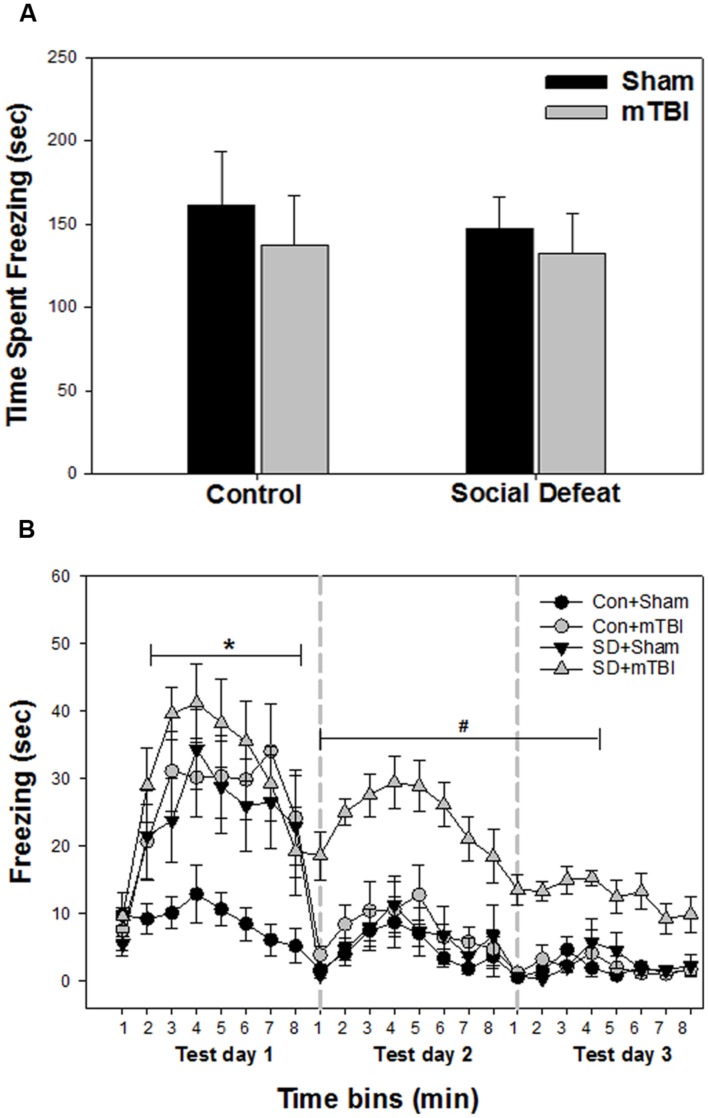
FIGURE 3.
Freezing behavior from contextual fear conditioning testing beginning 7 days following stress and/or mTBI, including (A) response to footshock during fear conditioning acquisition day and (B) response to context during the three test days in 1 min time bins, each 8 min test separated by 24 h (as indicated by the gray dashed vertical lines). ∗ Indicates significant difference from the control + sham group, while the symbol # indicates significant difference between the social defeat with mTBI vs. all other groups (p < 0.05).

