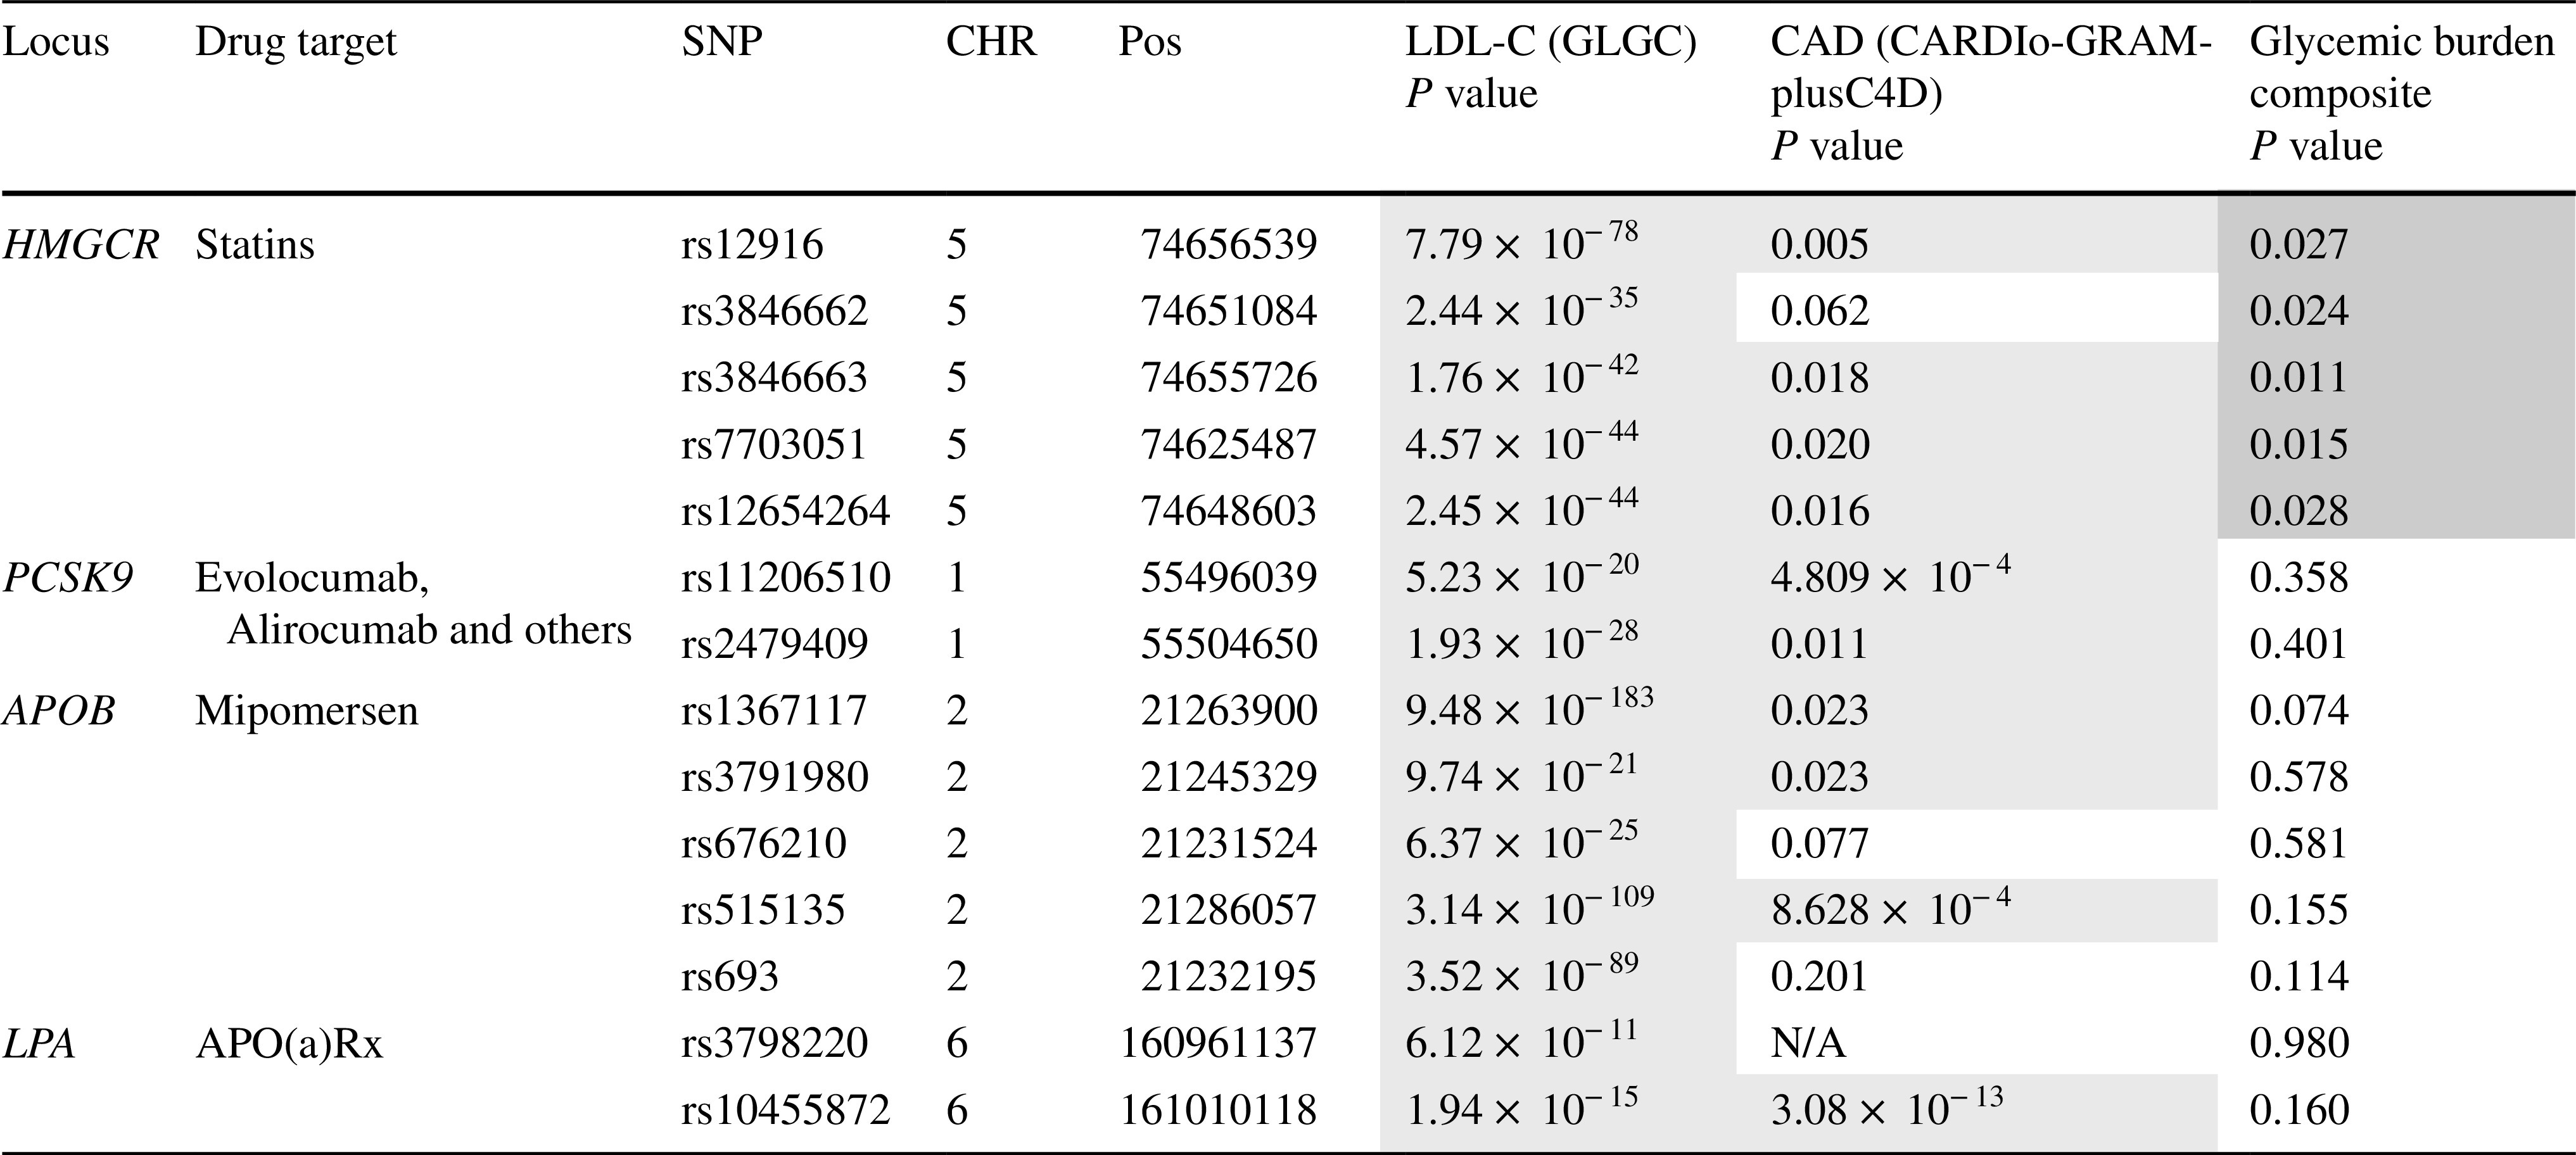
Table 1.
Association of variants in HMGCR, PCSK9, APOB and LPA with LDL-C, CAD risk and glycemic burden composite for GWAS Catalog SNPs (color figure online)

Blue = lower level of trait or risk of outcome; red = higher level of trait or risk of outcome
