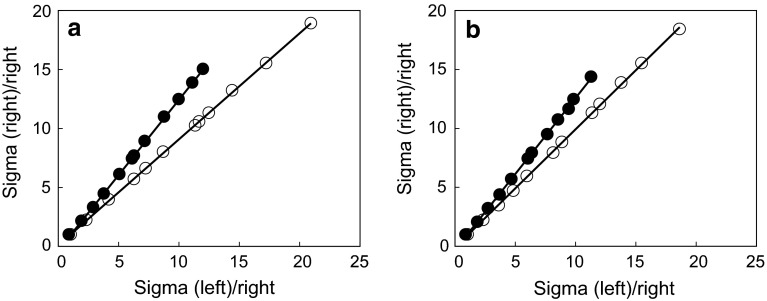
Fig. 5.
Logan plot analysis; representative indirect Logan plot analysis [28, 29] of right and left striatal uptake of control (open circle) or 6-OHDA injured (closed circle) rat after intravenous injection of [11C](R)-PK11195 (a) or [11C]CB184 (b) in a rat. The analyses were carried out employing uptake of the lesioned side as target and the contralateral side as reference. After linear regression of the each plot, distribution volume ratio (DVR) between right and left striatum was obtained from its slope (see text)

