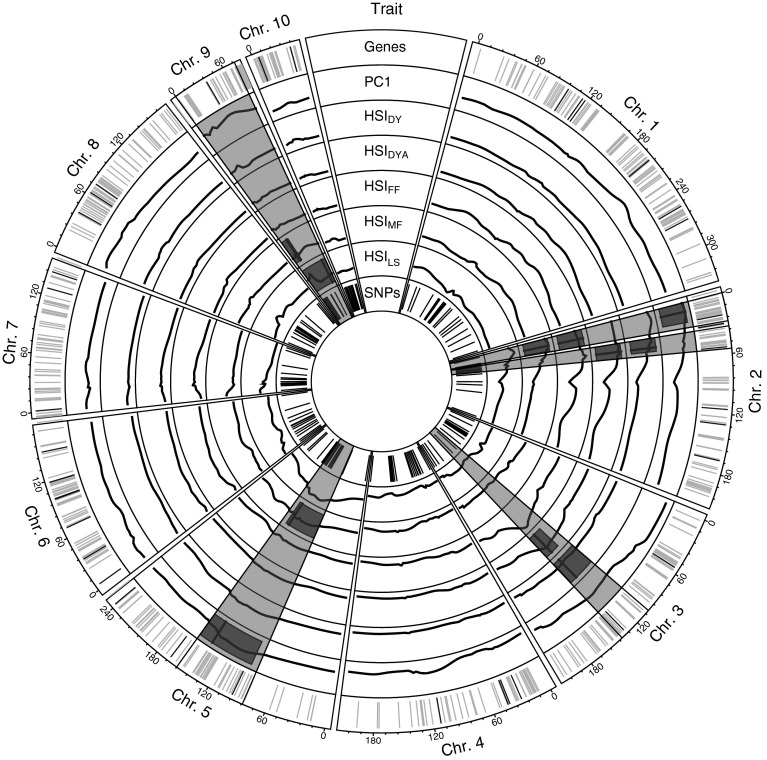
Fig. 6.
Genetic positions of heat-tolerance (black) and heat-responsive (orange) candidate genes in the quantitative trait loci (QTL) confidence intervals and flanking markers (black) of the QTL hot spot regions in the first track. Tracks 2–7 show logarithmic odds ratio (LOD) scores (circumferential black), detected QTL positions (radial black) and confidence intervals (red) of the QTL analyses for which QTL have been detected: principal component 1 (PC1) and the heat susceptibility indexes (HSI) of the traits dry yield (DY), adjusted dry yield (DYA), the time to female (FF) and male flowering (MF) and the leaf scorching (LS). QTL hot spots are denoted in transparent red. Genetic positions of SNP markers are shown in the most inner circle

