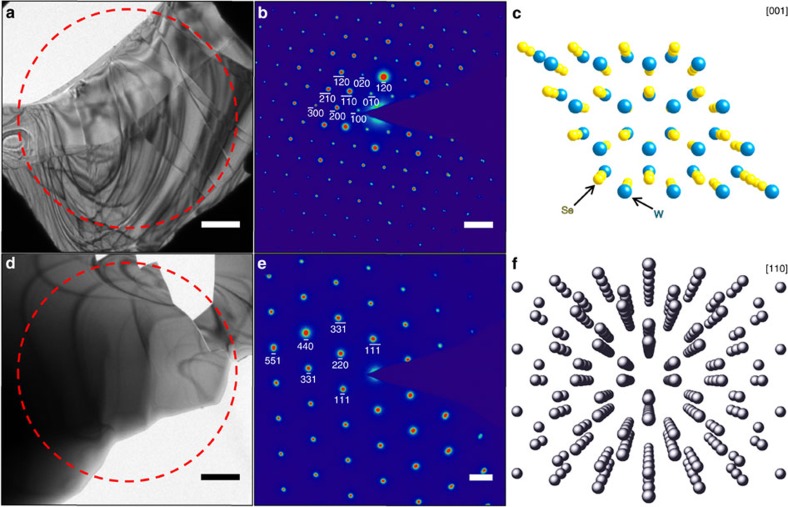
Figure 1. Morphological heterogeneity and atomic-scale order of the WSe2 and Ge specimen regions of interest.
(a,d) Bright-field images of (a) a WSe2 flake and (d) a thin Ge crystal. The red, dashed circle denotes the position of the selected-area aperture used to generate the diffraction patterns shown in b and e. Scale bars, 1 μm. (b,e) Corresponding selected-area diffraction patterns obtained approximately along the [001] and [110] zone axes for WSe2, and Ge, respectively, with several Bragg spots indexed. Scale bars, 5 nm−1 (b); 2 nm−1 (e). (c,f) Crystal structures of (c) WSe2 and (f) Ge, as viewed down the [001] and [110] zone axes, respectively. In c: yellow spheres=Se; blue spheres=W, as labelled.

