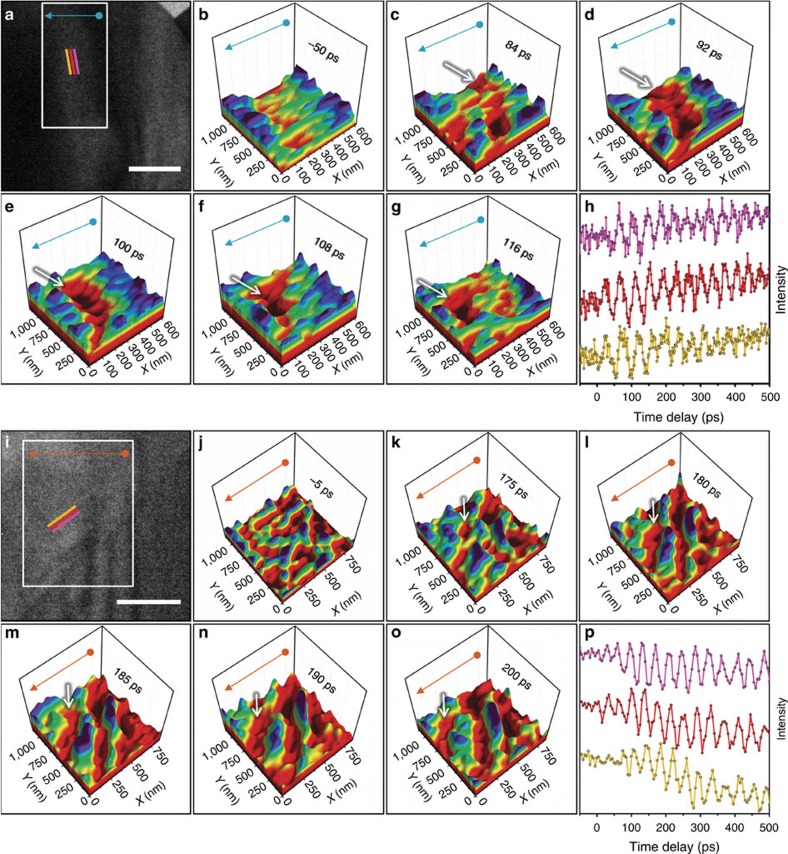
Figure 2. Real-space femtosecond electron imaging of single-phonon wavefronts in Ge and WSe2.
(a,i) Bright-field images of the Ge and WSe2 regions shown in Fig. 1 and obtained at −50 and −5-ps time delays, respectively. For the Ge experiments, the images were acquired with a 25-kHz repetition rate and a 13-s integration time per frame. For WSe2, the images were also acquired with a 25-kHz repetition rate but with an 18-s integration time per frame (see also the captions for Supplementary Videos 1 and 2 for further experimental details). The three coloured lines mark regions from which the mean intensity was quantified and used to generate the time traces in h and p (described below). The propagation direction is perpendicular to the coloured lines. Scale bars, 500 nm. (b–g) and (j–o) Surface plots generated from an image series (region of interest=white rectangles in a and i) highlighting approximately one period of wavetrain propagation, with a pre-time-zero frame included for reference. Motion of individual wavefronts, which appear as a continuous, deep-red depression, is indicated by the white arrows. The blue and orange arrows map the orientation to the two-dimensional images shown in a and i. (h,p) Image-intensity measurements, obtained at the coloured lines in a and i, as a function of time delay (offset for clarity).

