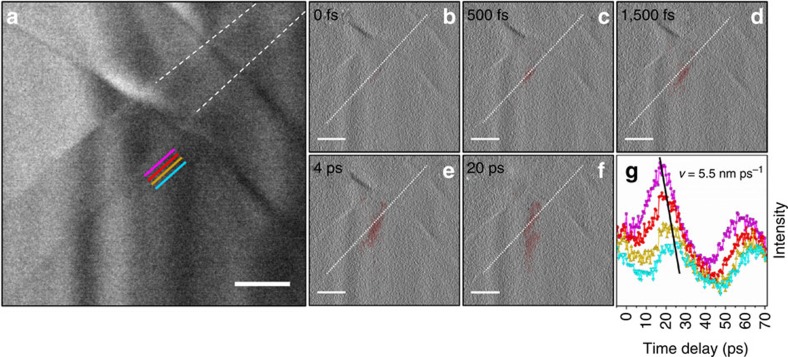
Figure 3. Femtosecond-resolved phonon nucleation and launch at a crystal step-edge.
(a) Bright-field image highlighting two step-edges (indicated by the partial dashed white lines) in the WSe2 flake. The coloured lines represent regions from which the mean intensity was quantified and used to generate the time traces in g. The images were acquired with a 50-kHz repetition rate and a 20-s integration time per frame (see also the captions for Supplementary Videos 3 and 4 for further experimental details). (b–f) Select processed micrographs revealing the nucleation and emergence of a localized phonon wavefront (red). The dotted white lines indicate the position of the step-edge from which the wavefront emerges. (g) Intensity measurements obtained at the coloured lines in a and plotted as a function of time delay. The slope of the line passing through the peaks of the first oscillation period reflects the wavefront velocity of 5.5 nm ps−1. Scale bars, 200 nm.

