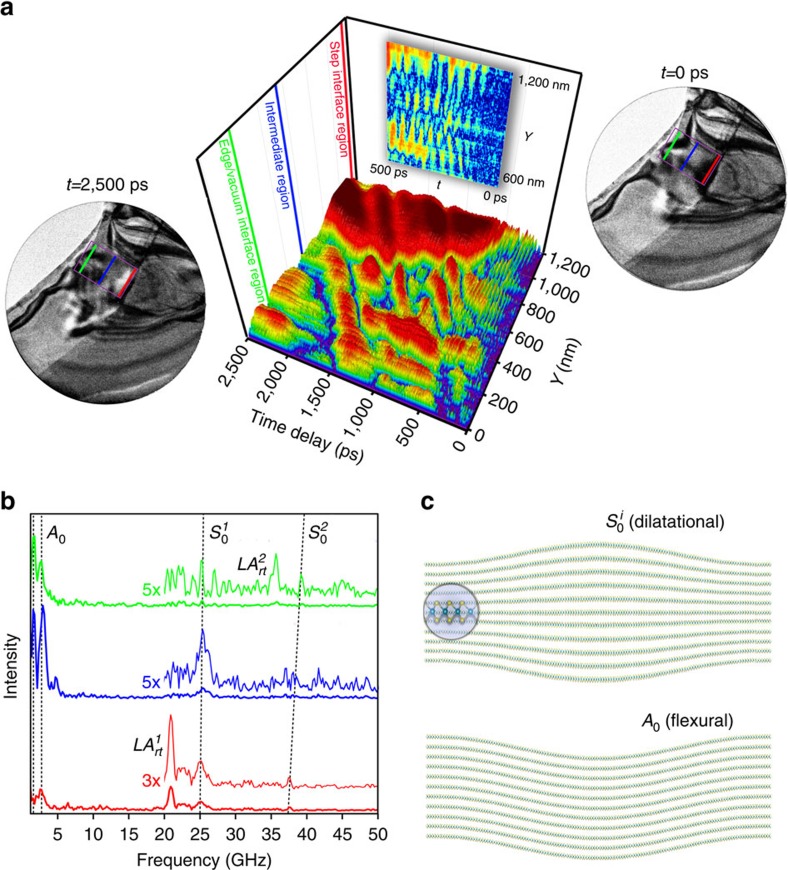
Figure 4. Analysis of distinct localized phonon modes in WSe2.
(a) Surface plot revealing the evolution of two primary modes, as observed in the region of interest highlighted in the accompanying images (t=0 and 2,500 ps; purple boxes). The images were acquired with a 25-kHz repetition rate and an 18-s integration time per frame (see also the captions for Supplementary Video 5 for further experimental details). The coloured lines demarcate the specific subregions analysed. The thin, near-vertical streaks predominantly in the sub-500-ps range and spanning the entire step interface region (600 to 1,200 nm; magnified in the inset) are produced by a relatively high-frequency mode, whereas the large amplitude, broad, diagonal features continuing out to the time-window limit are due to a more slowly propagating low-frequency mode. (b) Time-domain Fourier transform of traces obtained from the subregions marked by the coloured lines on the surface plot in a. The peaks arising from echoing of longitudinal acoustic phonons ( ) are labelled, while the travelling-wave modes (A0,
  ) are indicated by the dashed lines, highlighting propagation dispersion (see also Supplementary Fig. 4, which illustrates dispersion observed in the Ge crystal, and Supplementary Video 6, which shows the effects of edge shape on the appearance of propagating diffraction contrast). The superscript i indicates waves emanating from the thicker step-edge region (i=1) and from that bounded by the crystal-vacuum interface (i=2). The spectra are offset for clarity. (c) Schematic of the symmetry of the propagating phonon modes with magnified view of a single layer. The dilatational modes (
 , top) occur near 25 and 40 GHz, while the flexural modes (A0, bottom) range from 2 to 5 GHz.

