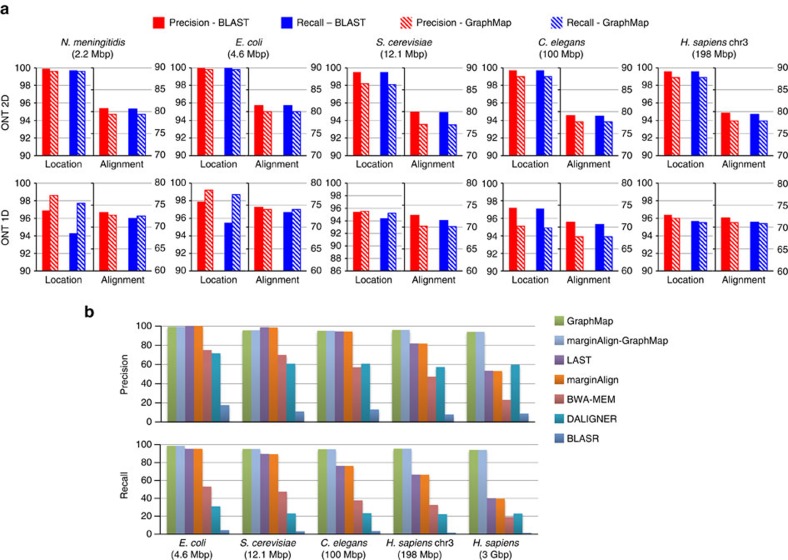
Figure 2. Evaluating GraphMap's precision and recall on synthetic ONT data.
(a) GraphMap (shaded bars) performance in comparison to BLAST (solid bars) on ONT 2D and 1D reads. Genomes are ordered horizontally by genome size from smallest to largest. For each data set, the graph on the left shows performance for determining the correct mapping location (within 50 bp; y axis on the left) and the one on the right shows performance for the correct alignment of bases (y axis on the right; Methods section). (b) Precision and recall for determining the correct mapping location (within 50 bp) for various mappers on synthetic ONT 1D reads.

