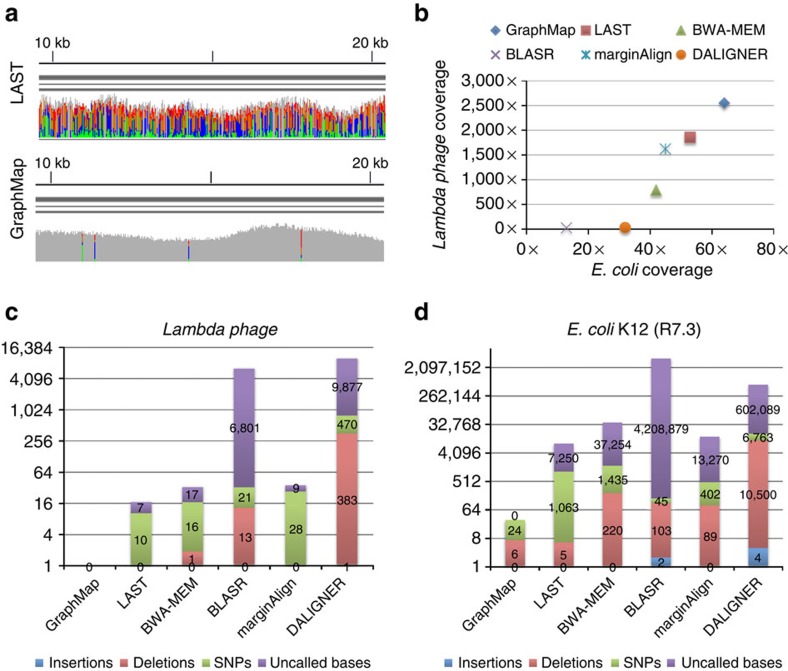
Figure 3. Sensitivity and mapping accuracy on nanopore sequencing data.
(a) Visualization of GraphMap and LAST alignments for a lambda phage MinION sequencing data set12 (using integrative genomics viewer (IGV) (ref. 36)). Grey columns represent confident consensus calls while coloured columns indicate lower quality calls. (b) Mapped coverage of the lambda phage12 and the E. coli K-12 genome31 (R7.3 data) using MinION sequencing data and different mappers. (c) Consensus calling errors and uncalled bases using a MinION lambda phage data set12 and different mappers. (d) Consensus calling errors and uncalled bases using a MinION E. coli K-12 data set (R7.3) and different mappers.

