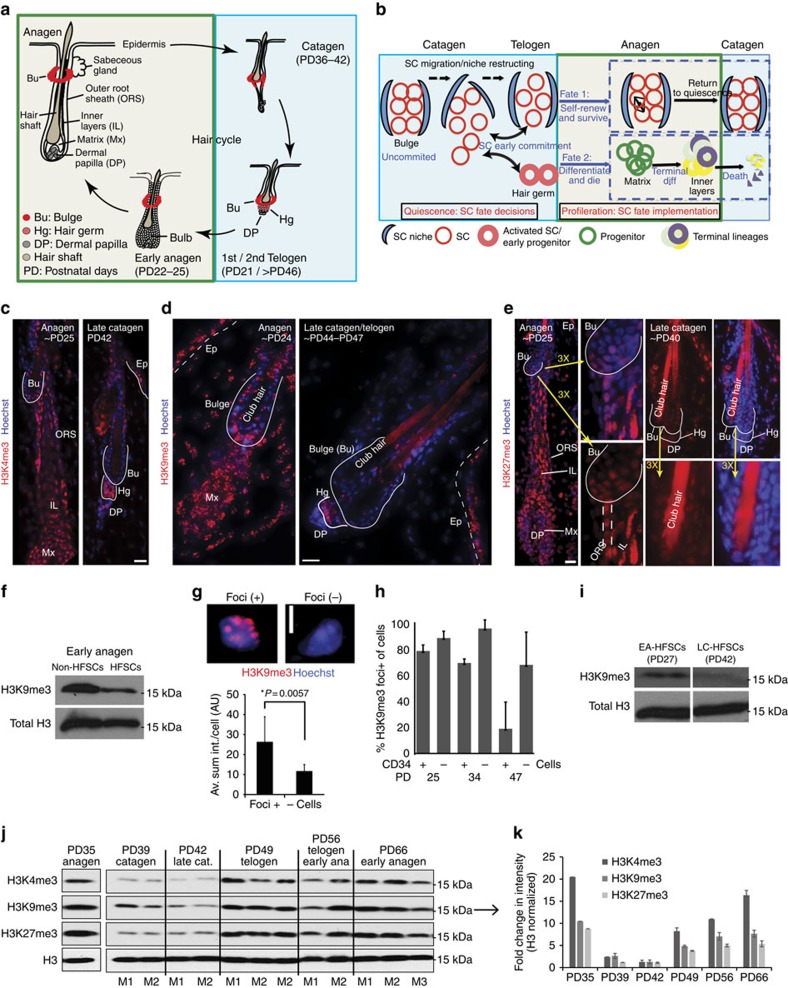
Figure 1. Distinct low levels of histone H3 K4/K9/K27me3 in quiescent (catagen) HFSCs.
(a,b) Depiction of hair cycle and fate choices of bulge HFSCs during quiescence, before activation. (c,e) Immunofluorescence staining of histone methyl marks at hair cycle stages indicated (Bu, bulge; DP, dermal papillae; Ep, epidermis; Hg, hair germ; IL, inner layers; Mx, matrix; ORS, outer root sheath). Scale bars, 10 μm. (f) Western blot of H3K9me3 in histone extracts from FACS-isolated cells. (g) Quantification of fluorescence intensity of z-stack images of Foci+ and Foci- cells in the bulge from PD24 hair follicle sections shows a significant difference (Student's t-test). AU, Arbitrary Unit. Scale bar, 5 μm. (h) Fraction of H3K9me3 foci+ cells, quantified on cytospin of FACS-isolated cells derived from mice at PD25 (anagen, proliferation), PD34 (late anagen, ceasing proliferation) and PD47 (telogen, quiescence). (i) Western blot of H3K9me3 on FACS-isolated HFSCs at early anagen (EA) and late catagen (LC). Notice the reduction of H3K9me3 in late catagen. (j) Western blot of histone marks on total skin histone extracts from different stages of hair cycle. Notice the reduction of all three marks in catagen skin relative to other stages. All western blots showed a single band between 15 and 17 kDa region, which corresponds to the correct size of histone H3 protein. (k) Band intensities from j were quantified and normalized to total H3 to calculate the fold differences. Fold changes were averaged among mice at the same stage.

