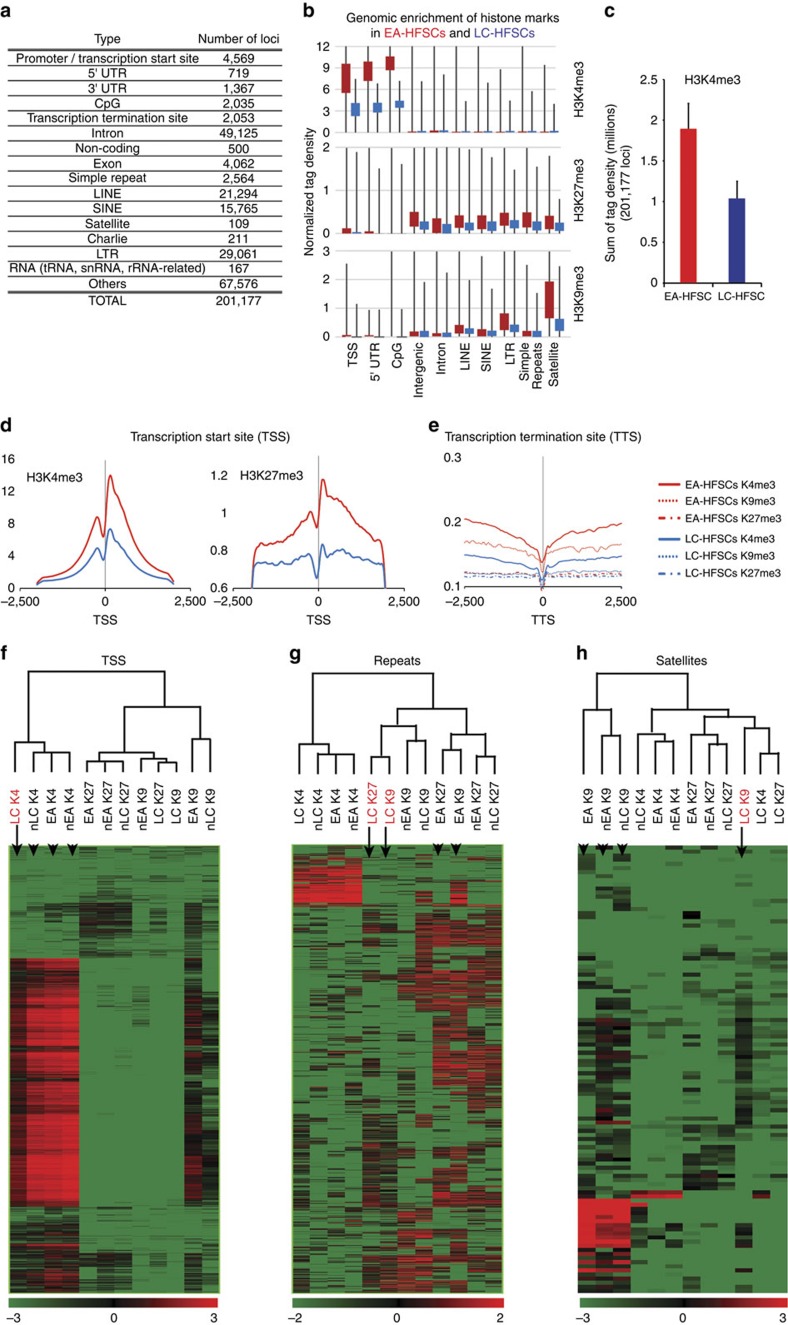
Figure 3. Reduction of H3 K4/K9/K27me3 at functional genomic regions at catagen.
(a) List of all genomic regions covered by MACS peaks from three marks in all four populations. (b) Box whisker plot of genomic enrichment of histone marks in EA-HFSCs (red) and LC-HFSCs (blue). Number of reads was normalized to 1 million of total mapped reads (normalized tag density). Note that the individual histone marks are higher at expected regulatory sites relative to the rest of the genome (for example, enrichment of H3K4me3 in TSS/promoters, H3K27me3 in intergenic and H3K9me3 in satellite regions), yet display overall decrease compared with EA-HFSCs. See the Methods for detail. (c) Average sum of all tag densities of H3K4me3 in all chromosomal loci analysed. Note that the overall peak intensity is lower by ∼2-fold in LC-HFSCs. (d) Average distribution of H3K4me3 (left panel) and H3K27me3 (right panel) in transcription start sites (TSS) of EA-HFSCs (red) and LC-HFSCs (blue) and (e) all three marks in transcription termination sites (TTS; right panel). Note the clear reduction of marks in LC-HFSCs. (f–h) Quantitative heat plot analysis of H3K4me3 (K4), H3K27me3 (K27) and H3K9me3 (K9) levels on TSS (f), simple repeats (g) or satellite regions (h). Notice the reduction of marks in LC-HFSCs highlighted in red (arrow versus arrowheads). UTR, untranslated region; LINE, Long Interspersed Nuclear Element; SINE: Short Interspersed Elements; LTR, Long Terminal Repeats.

