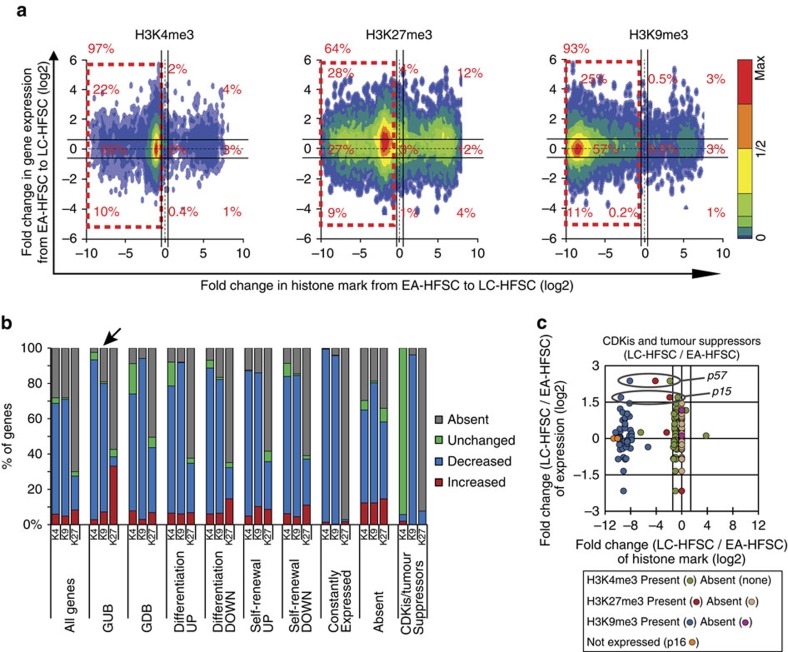
Figure 4. Correlation of level changes in H3 K4/K9/K27me3 changes and mRNA.
(a) Density plot of all genes in the mouse genome that show signal by either microarray or ChIP-seq (N=24,778 genes and N=10,345 genes plotted for H3K4me3/H3K9me3 and H3K27me3, respectively, out of total N=34,497 genes. Genes that showed the absence of microarray or ChIP signals in comparing populations were excluded). Genes changed ≥1.5-fold are marked outside the black lines flanking the origin; genes with <1.5-fold variations are considered ‘unchanged'. (b) % of genes that are decreased (blue), unchanged (green) and increased (red) in their histone marks from EA-HFSCs to LC-HFSCs. Each functional category was defined based on changes in mRNA levels in HFSCs at distinct stages of differentiation and self-renewal (GDB: genes downregulated in the bulge). See the Methods for description of arrays used and Supplementary Data 2 for the lists of genes. Note atypical behaviour of genes upregulated in the bulge (GUB) and tumour suppressors. (c) Dot plot of cyclin-dependent kinase inhibitors (CDKis) and known tumour suppressors that play a role in skin and hair follicle biology (Supplementary Data 2). Expression of CDKis was adopted from our previous qRT–PCR data46, whereas mRNA values for the other genes were from microarrays (Supplementary Data 1).

