Figure 1.

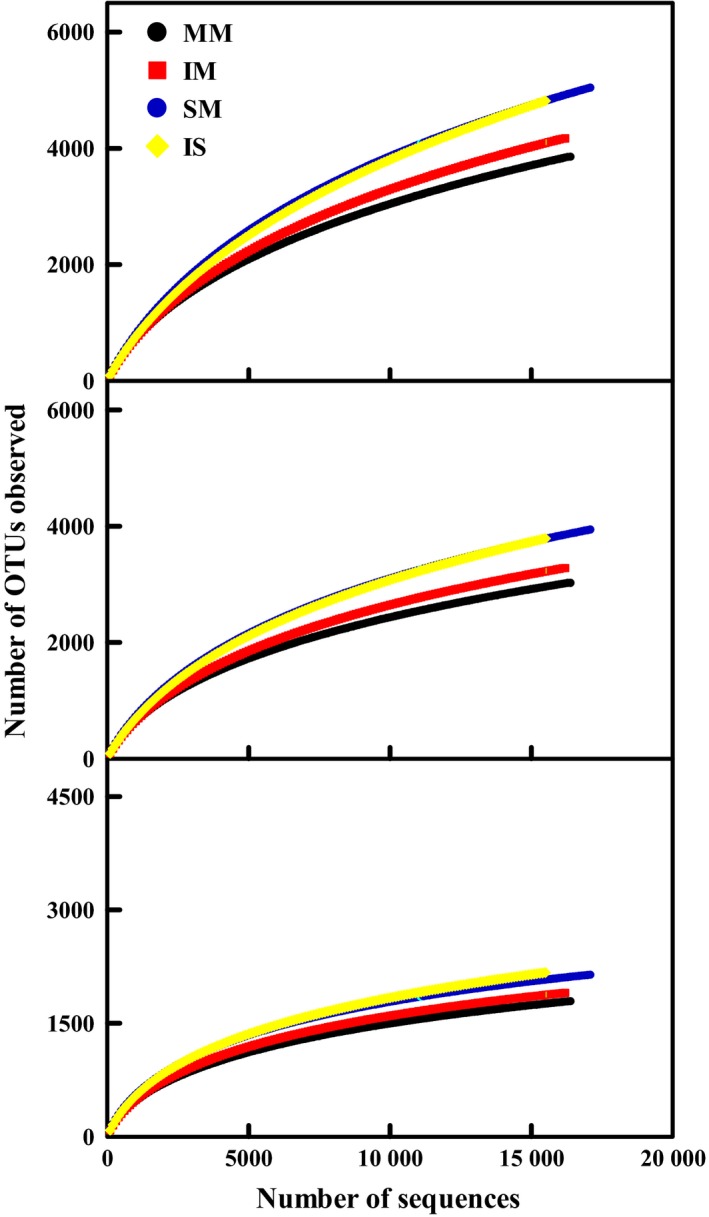
Rarefaction curves indicating the observed number of OTUs at genetic distances of 3%, 5% and 10% in all soil samples. MM, mulberry monoculture; IM, intercropping mulberry; SM, soybean monoculture; IS, intercropping soybean.

Rarefaction curves indicating the observed number of OTUs at genetic distances of 3%, 5% and 10% in all soil samples. MM, mulberry monoculture; IM, intercropping mulberry; SM, soybean monoculture; IS, intercropping soybean.