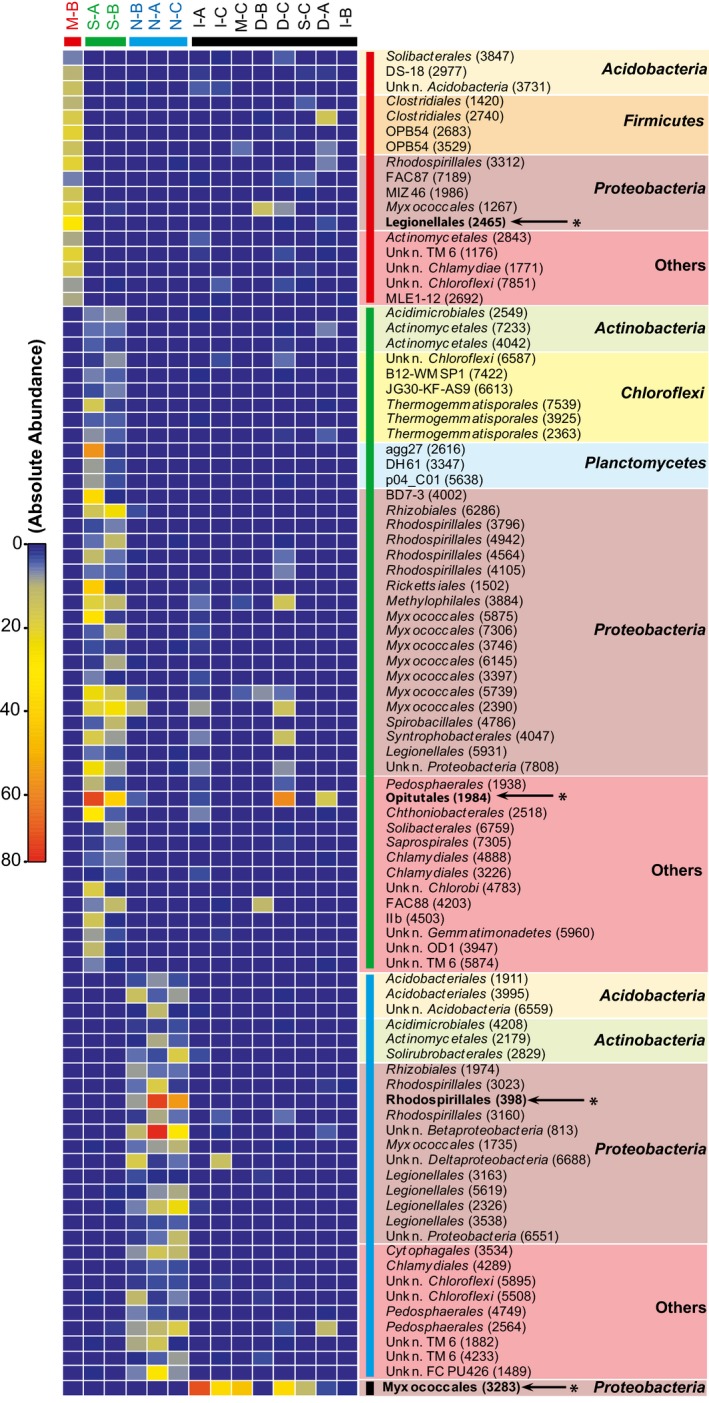
Figure 4.

Identification of soil multifunctional molecular indicators. The heatmap shows the absolute abundance of OTUs detected in the soil samples categorized into the four multifunctional classes previously defined (Fig. 2A). Colour bars show the assignation of the soil samples to their multifunctional class (red; class I, green; class II, blue; class II and black; class IV). Taxonomic assignation of the OTU was done using the Greengene reference database V13_8_99 (McDonald et al., 2012). Representative indicators are highlighted with bold characters and are identified with an arrow and asterisk (← *).
