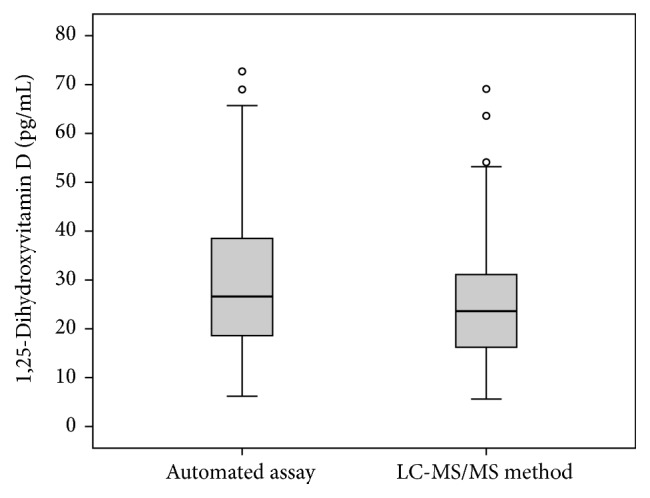
Figure 1.

Box and whisker plots showing the distribution of results for the automated assay and the LC-MS/MS method. The central boxes express the upper and lower quartile, and the central lines show the median. The whiskers represent the values below and above the interquartiles, excluding outliers. Outliers (circles) are defined as values that exceed the upper and lower quartile plus or minus 1.5 times the interquartile range.
