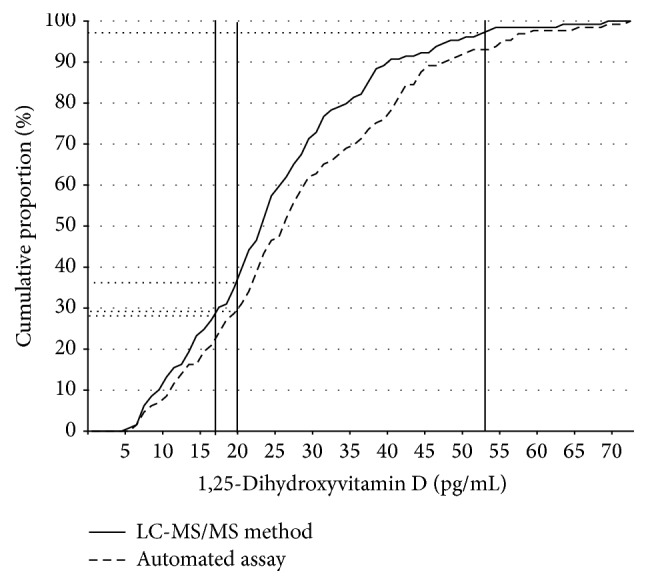
Figure 2.

Ogive showing the percentage of specimen with 1,25-dihydroxyvitamin D concentrations below a certain value according to test procedure. The vertical lines mark different cut-off levels for deficient or harmful 1,25-dihydroxyvitamin D concentrations.
