Figure 1.
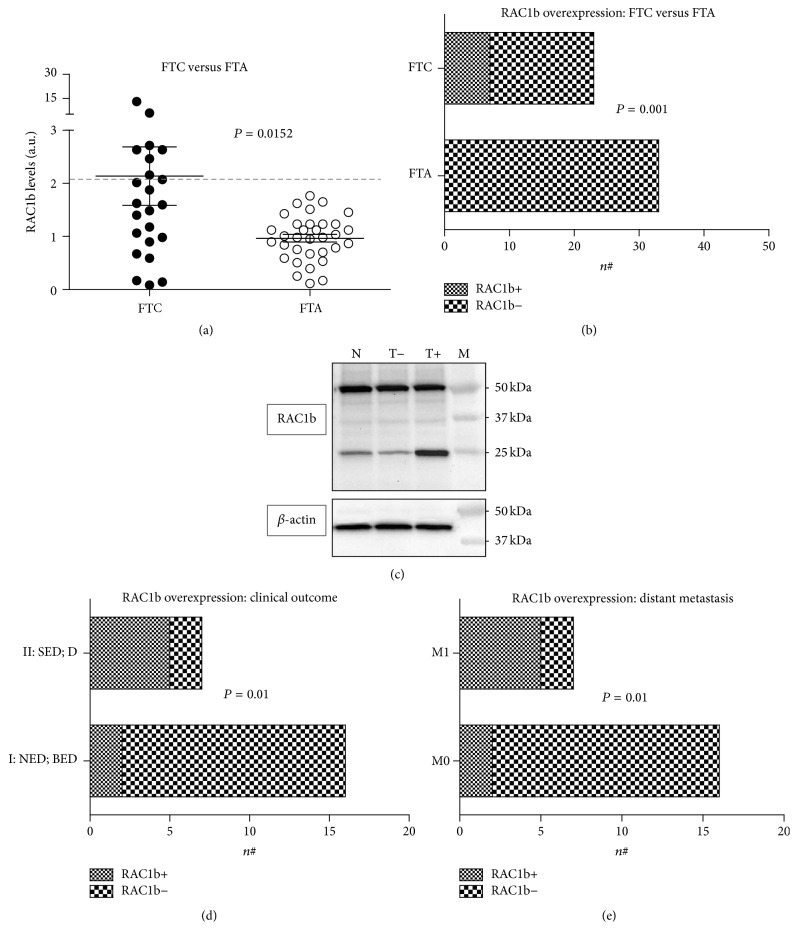
RAC1b expression in follicular thyroid tumors. (a) Expression levels of RAC1b among FTCs (n = 23) and FTAs (n = 33). RAC1b expression levels, quantified by qRT-PCR, correspond to arbitrary units representing fold differences relative to the reference sample; the threshold value defining RAC1b overexpression was set at 2.133 (corresponding to the mean plus two standard deviations of RAC1b expression level in a set of normal thyroid tissue samples). (b) Comparative analysis of RAC1b overexpression (RAC1b+) between follicular thyroid carcinomas (FTC) and follicular thyroid adenomas (FTA). (c) Western blot analysis of RAC1b protein levels in normal thyroid (N) and RAC1b overexpressing (T+) and nonoverexpressing (T−) tumors; protein molecular weight marker (M). (d) Association of RAC1b overexpression (RAC1b+) with clinical outcome (Group I: NED: no evidence of disease, BED: biochemical evidence of disease; Group II: SED: structural evidence of disease, D: death due to disease). (e) Association of RAC1b overexpression (RAC1b+) with the presence (M1) or absence (M0) of distant metastases.

