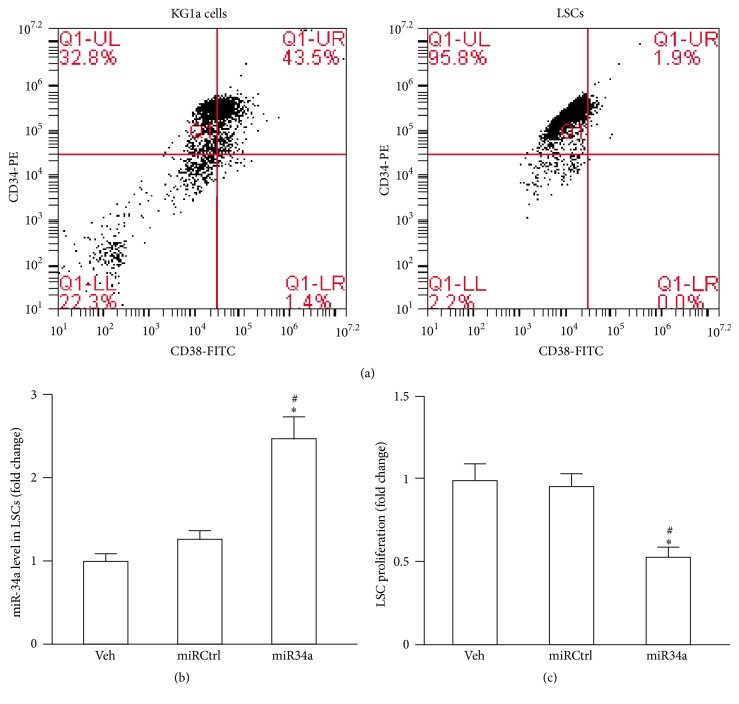
Figure 1.
LSC characterization and the effect of miR34a overexpression on LSC proliferation. (a) Representative flow cytometric plots of CD34-PE versus CD38-FITC. Expressions of CD34 and CD38 in KG1a cells before sorting (left) and after sorting (right). (b) LSCs were subjected to vehicle (veh) treatment and transfected with miRCtrl or miR34a mimic as indicated and 2 days later the miR34a level was measured by qRT-PCR. (c) LSCs were subjected to treatment with veh or miRCtrl transfection or miR34a mimic transfection. After 2 days, the LSC proliferation was determined by MTT assay. Data represents mean ± SEM. ∗ P < 0.05 versus veh; # P < 0.05 versus miRCtrl.

