Figure 1.
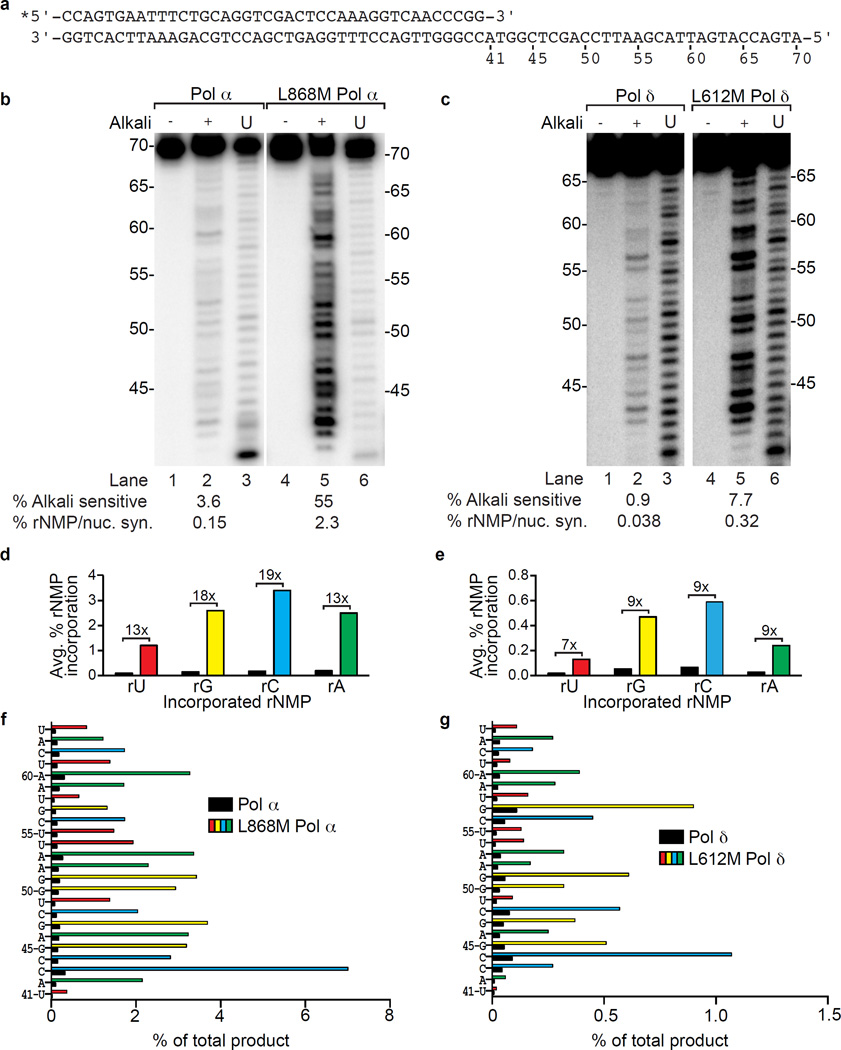
Ribonucleotide incorporation in vitro by variants of Pols α and δ. (a) Sequence of primer-template used for reactions in panels b and c. (b) Stable rNMP incorporation into DNA. The lane marked U depicts the product generated by Pol α or L868M Pol α prior to gel purification, as described in1. Lanes marked with (−) and (+) depict gel-purified products treated with 0.3 M KCl (−) or KOH (+). The percentages of alkali-sensitive products and rNMP incorporated per nucleotide synthesized are shown below each lane. The mean and range for duplicate measurements was 3.6 ± 0.3 for Pol α and 55 ± 0.5 for L868M Pol α. (c) As in panel b, but for DNA products made by Pol δ (0.9 ± 0.2) and L612M Pol δ (7.7 ± 1.5). (d) Average frequency of ribonucleotide incorporation for rU, rA, rC and rG calculated from panel b. The relative difference in ribonucleotide incorporation between Pol α and L868M Pol α is shown above each base. (e) As in panel d, but for Pol δ and L612M Pol δ using data from panel c. (f) Percentage of rNMP incorporation by Pol α or L868M Pol α at each of 24 template positions. The position and identity of each incorporated ribonucleotide is displayed on the Y-axis. (g) As in panel f, but for ribonucleotide incorporation by Pol δ or L612M Pol δ.

