Figure 2.
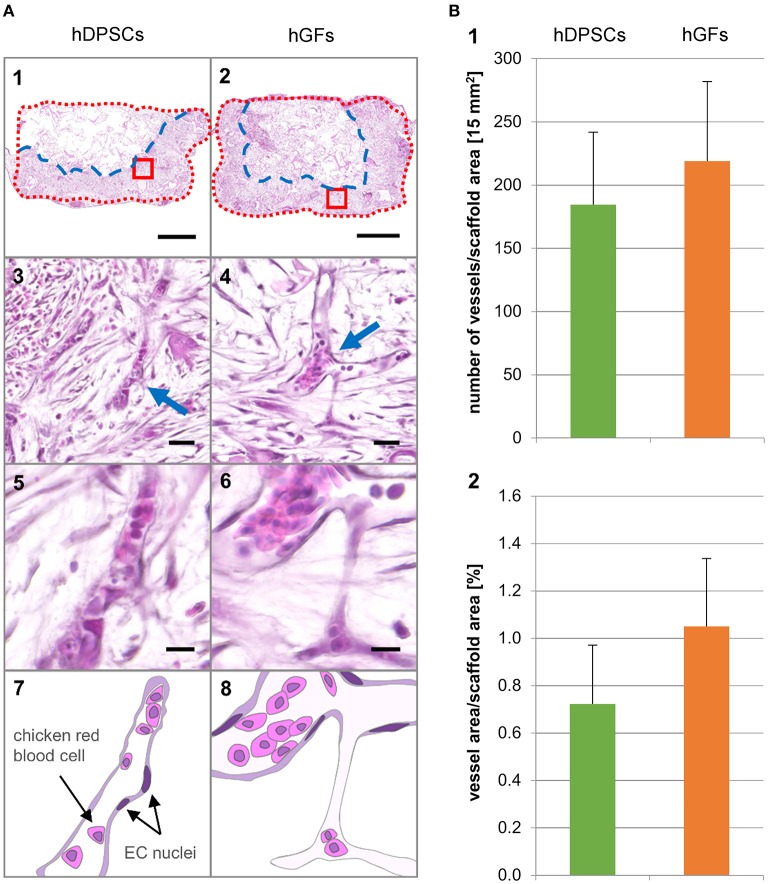
Hematoxylin and Eosin stainings of longitudinal sections and histomorphometric analysis. (A1, 3, 5, 7) hDPSCs-seeded scaffolds. (A2, 4, 6, 8) hGFs-seeded scaffolds. (A1, 2) Scaffold section overview. Blue dashed line indicates the front line of the growing tissue. Red dotted line indicates the outline of the scaffold. Scale bar = 1 mm. (A3, 4) Magnifications showing vascularization in the area marked with a red box in the corresponding overview picture. Arrows indicate capillaries. Scale bar = 25 μm. (A5, 6) Magnifications showing single capillaries. Scale bar = 10 μm. (A7, 8) Schematic representation of the capillaries shown in 5 and 6. (B1) Number of vessels per scaffold area. (B2) Percent vessel area per scaffold area. Values are given as mean ± standard deviation. No statistically significant differences were found. EC, endothelial cells; hDPSCs, human dental pulp stem cells; hGFs, human gingival fibroblasts.

