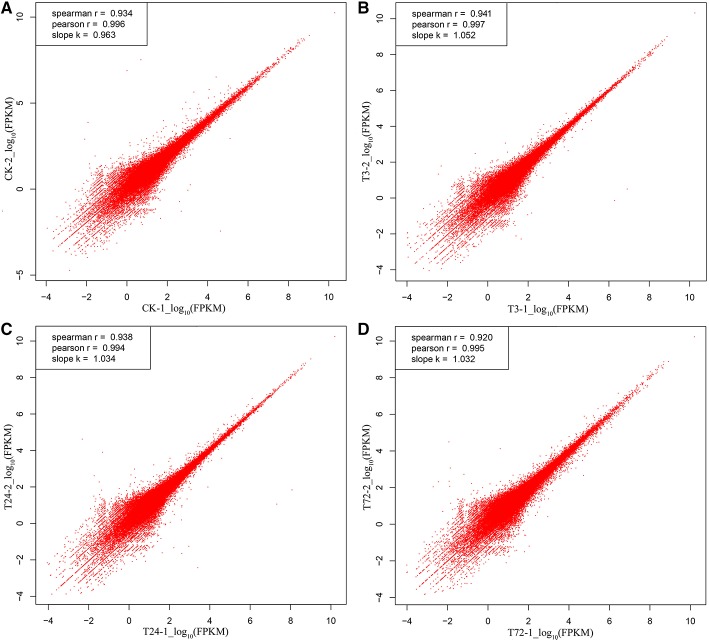
Figure 3.
Pearson correlation analysis of the two replicates in each group. The vertical and horizontal axes represent the scale of the expression levels for all unigenes [log10RPKM (number of reads per kilobase per million clean reads)]. (A) control samples (CK-1 and CK-2); (B) PBZ-treated samples in 3 h (T3-1 and T3-2); (C) PBZ-treated samples at 24 h (T24-1 and T24-2); (D) PBZ-treated samples at 72 h (T72-1 and T72-2).

