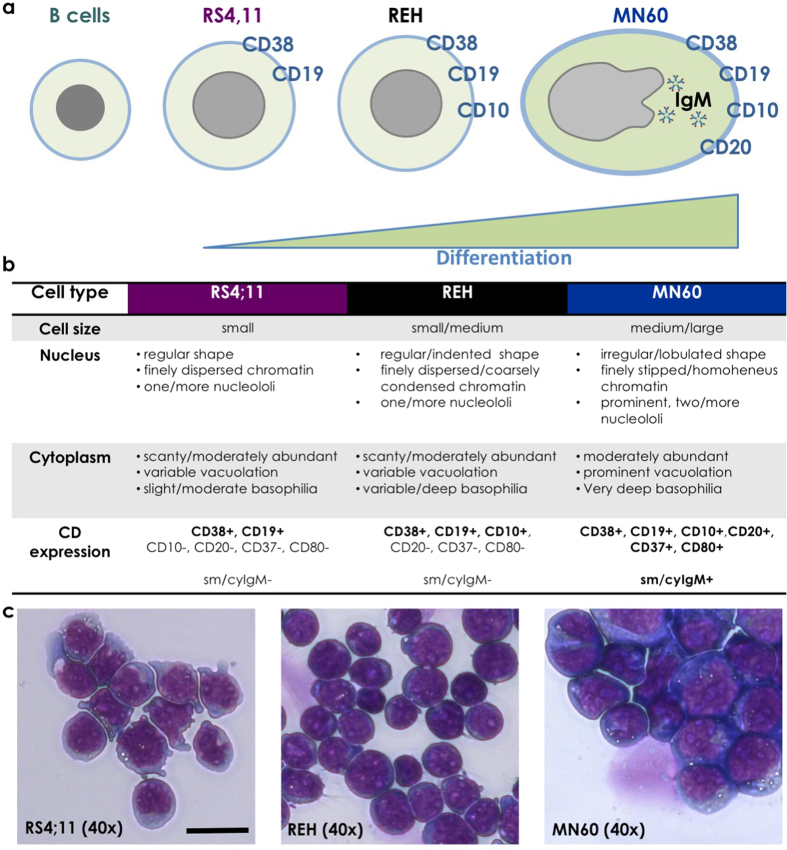
Figure 1. Differentiation scheme and morphology of the RS4;11, REH and MN60 B-leukemia cell lines.
(a) Immunophenotypic profile with the coordinate and sequential well-characterized plasma-membrane antigen expression. (b) Morphologic features and immunophenotypic expression pattern. (c) Representative images of the cell morphology using May Grunwald-Giemsa histochemical staining for DNA and RNA molecules. Scale bar: 10 μm.

