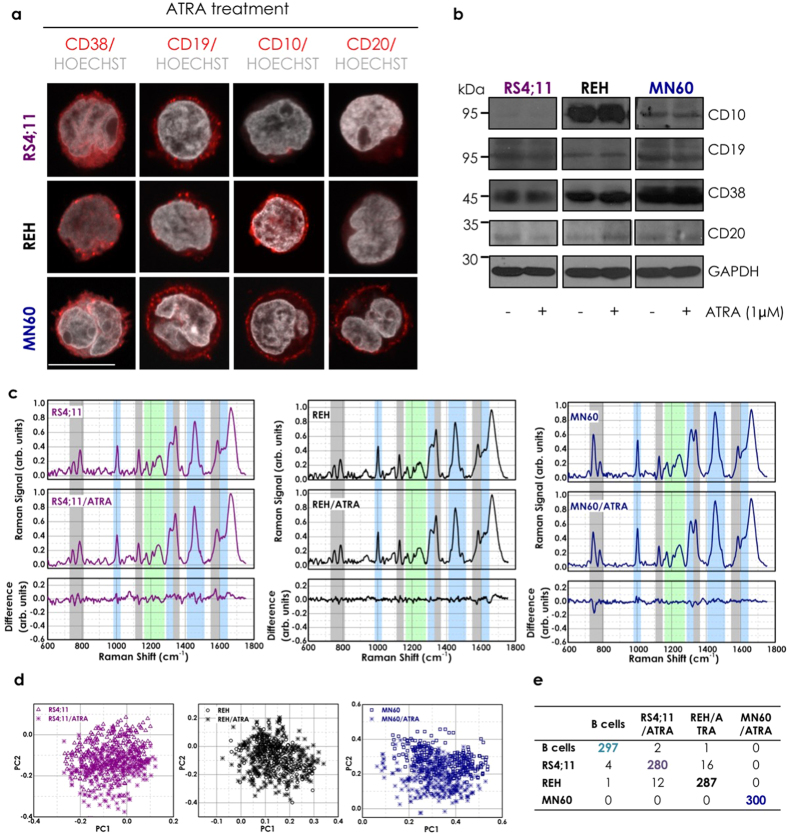
Figure 4. Effect of ATRA treatment on acute lymphocytic leukemia cells.
(a) Representative confocal microscopy images of RS4;11, REH and MN60 B-leukemia cells treated with 1 μM ATRA for 72 h, and fixed and processed for immunofluorescence analysis with anti-CD38, anti-CD19, anti-CD10 and anti-CD20 monoclonal antibodies (red) to monitor their expression levels. Gray, Hoechst-33258 nucleic-acid staining. Scale bar: 10 μm. (b) Representative immunoblotting of RS4;11, REH and MN60 B-leukemia cells treated as in a, with antibodies against CD10, CD19, CD20 and CD38 (as indicated). Glyceraldehyde 3-phosphate dehydrogenase (GAPDH) is shown for the internal protein levels and molecular weight standards (kDa) are indicated on the left of each panel. The blots have been run under the same experimental conditions. (c) Raman spectra of three B-leukemia cell lines recorded without and with ATRA treatment as in. (a) The difference spectra were obtained by subtracting the untreated from the treated spectra (bottom panels). (d) PCA scatter plots comparing the untreated and ATRA-treated B-leukemia cells. (e) Confusion matrix for the classification of the untreated and ATRA-treated B-leukemia cells.

