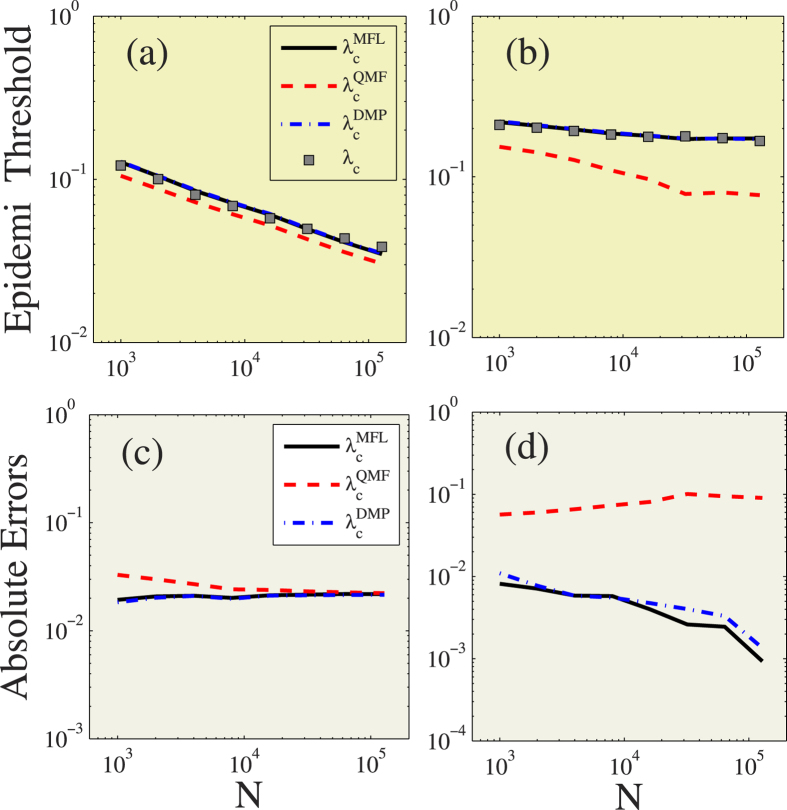
Figure 1. Predicting epidemic threshold for uncorrelated configuration networks under different network sizes.
Theoretical predictions of  (black solid lines),
  (red dashed lines),
  (blue dash-dotted lines) and numerical prediction (gray squares) versus network size N for degree exponent νD = 2.1 (a) and νD = 3.5 (b). The absolute errors between λc and
  (black solid lines),
  (red dashed lines) and
  (blue dash-dotted lines) versus N for νD = 2.1 (c) and νD = 3.5 (d).

