
Figure 2. Comparing the accuracy between three types of theoretical and numerical predictions of the epidemic threshold on 56 real-world networks.
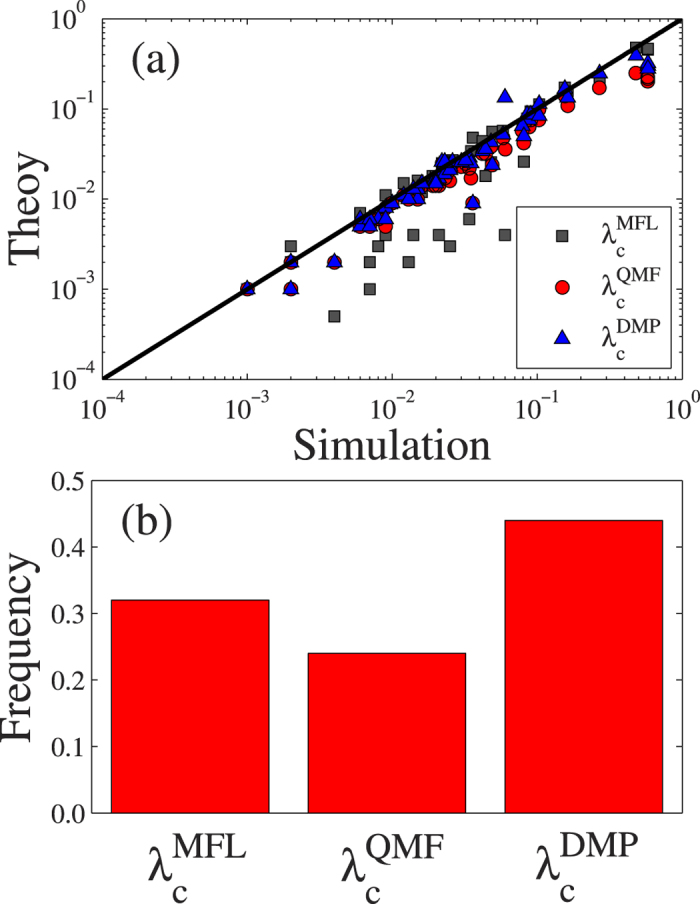
(a) Theoretical predictions of  (gray squares),
  (red circles) and
  (blue up triangles) versus numerical predictions λc of the epidemic threshold. (b) In all the entire sample of real-world networks, the fraction of
  [
[ or
or  ] is the closest value to λc.