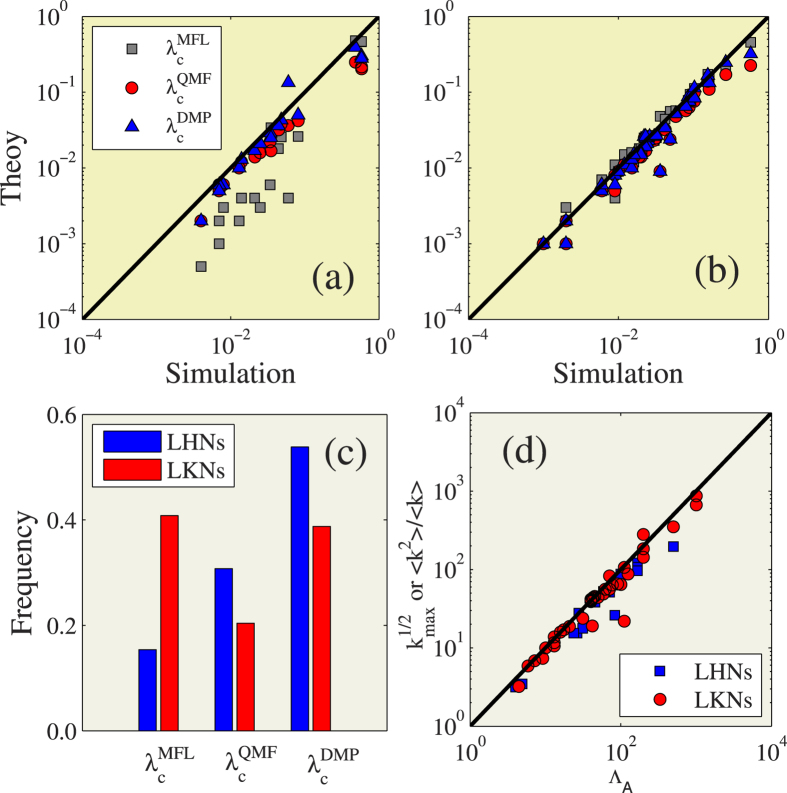
Figure 4. Verify the accuracy for three types of theoretical epidemic threshold on real-world networks.
The theoretical predictions of  (gray squares),
  (red circles) and
  (blue up triangles) versus numerical predictions λc of the epidemic threshold on (a) LHNs and (b) LKNs. (c) In the collective of LHNs and LKNs of real-world networks, the fraction of
  [
[ or
or  ] is the closest value to λc. (d) The values of
  for LHNs and 〈k2〉/〈k〉 for LKNs versus the leading eigenvalue ΛA of the adjacent matrix.

