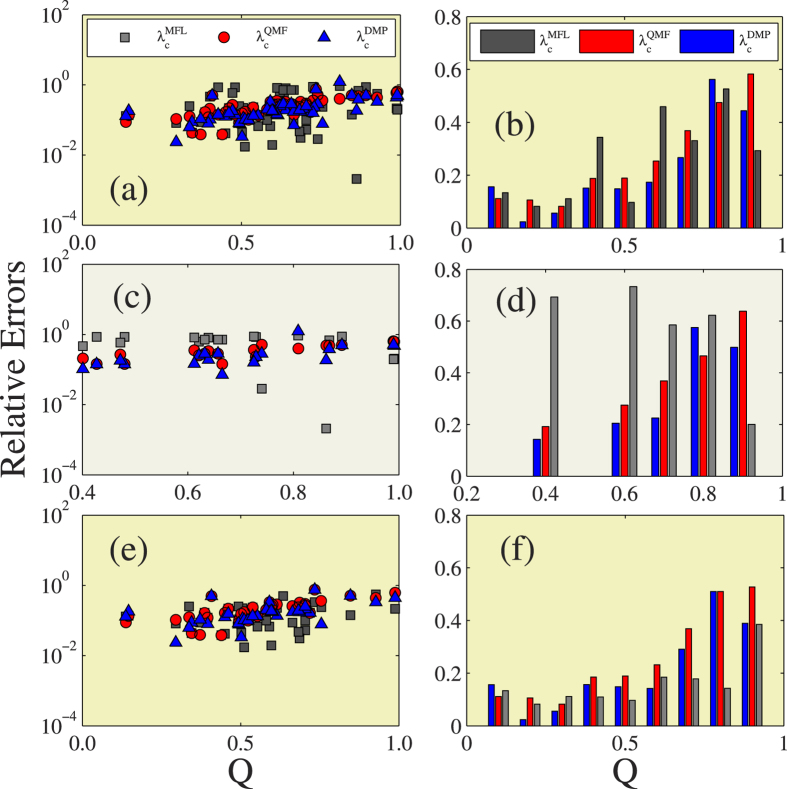
Figure 7. Effects of modularity on the relative errors of different theoretical prediction.
In the first column, figures (a,c,e) are the the relative errors of the three different theoretical predictions versus modularity Q. In the second column, figures (b,d,f) are the the average relative errors for the three different theoretical predictions versus Q. The first row exhibits the results of 56 real-world networks, the second row shows the results of LHNs, the third row performs the results of the LKNs.

