
Figure 4.
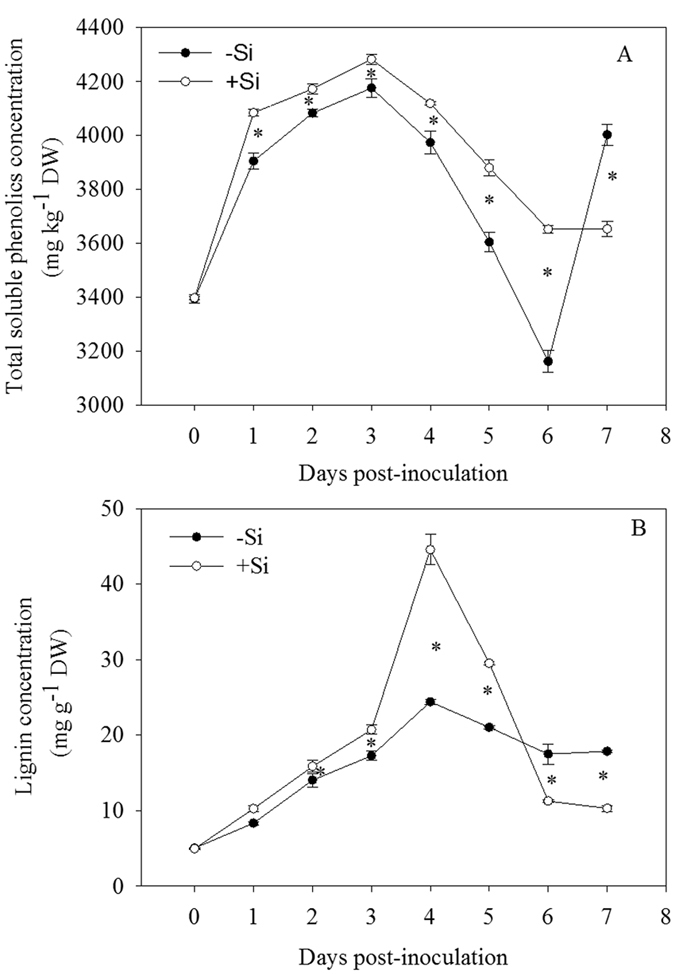
Changes in concentrations of total soluble phenolics (A) and lignin (B) in leaves of rice seedlings amended with silicon (+Si) or not (−Si) post-inoculation with Xoo. The values are means of three replications. Vertical lines represent standard deviations. Asterisks denote significant difference at P < 0.05 between +Si and −Si treatments at a same time-point according to Student’s t-test.